
Health Monitor: Stream Quality Monitoring
Health Monitor is a tab inside a live event that shows technical metrics of the incoming stream in real time and stores their history after the stream ends. This helps quickly diagnose issues and resolve incidents independently without contacting support.
Who this article is for
- Stream organizers — need to monitor stream quality during a live broadcast
- Technical specialists — need to quickly identify the cause of degradation or stream drops
- Platform administrators — need metric history to investigate incidents after a broadcast
How to open Health Monitor
- Go to Live and open the required live event.
- On the event page, select the Health Monitor tab.
Metrics during a live stream
During an active broadcast, Health Monitor displays the following indicators in real time with an update delay of no more than 2 seconds:
| Metric | Description |
|---|---|
| Video bitrate | Video stream bitrate in kbps |
| Audio bitrate | Audio stream bitrate in kbps |
| FPS | Frame rate |
| Packet loss (%) | Percentage of lost packets |
| Streamer IP | IP address of the stream source |
| RTMP server | Address of the stream receiving server |
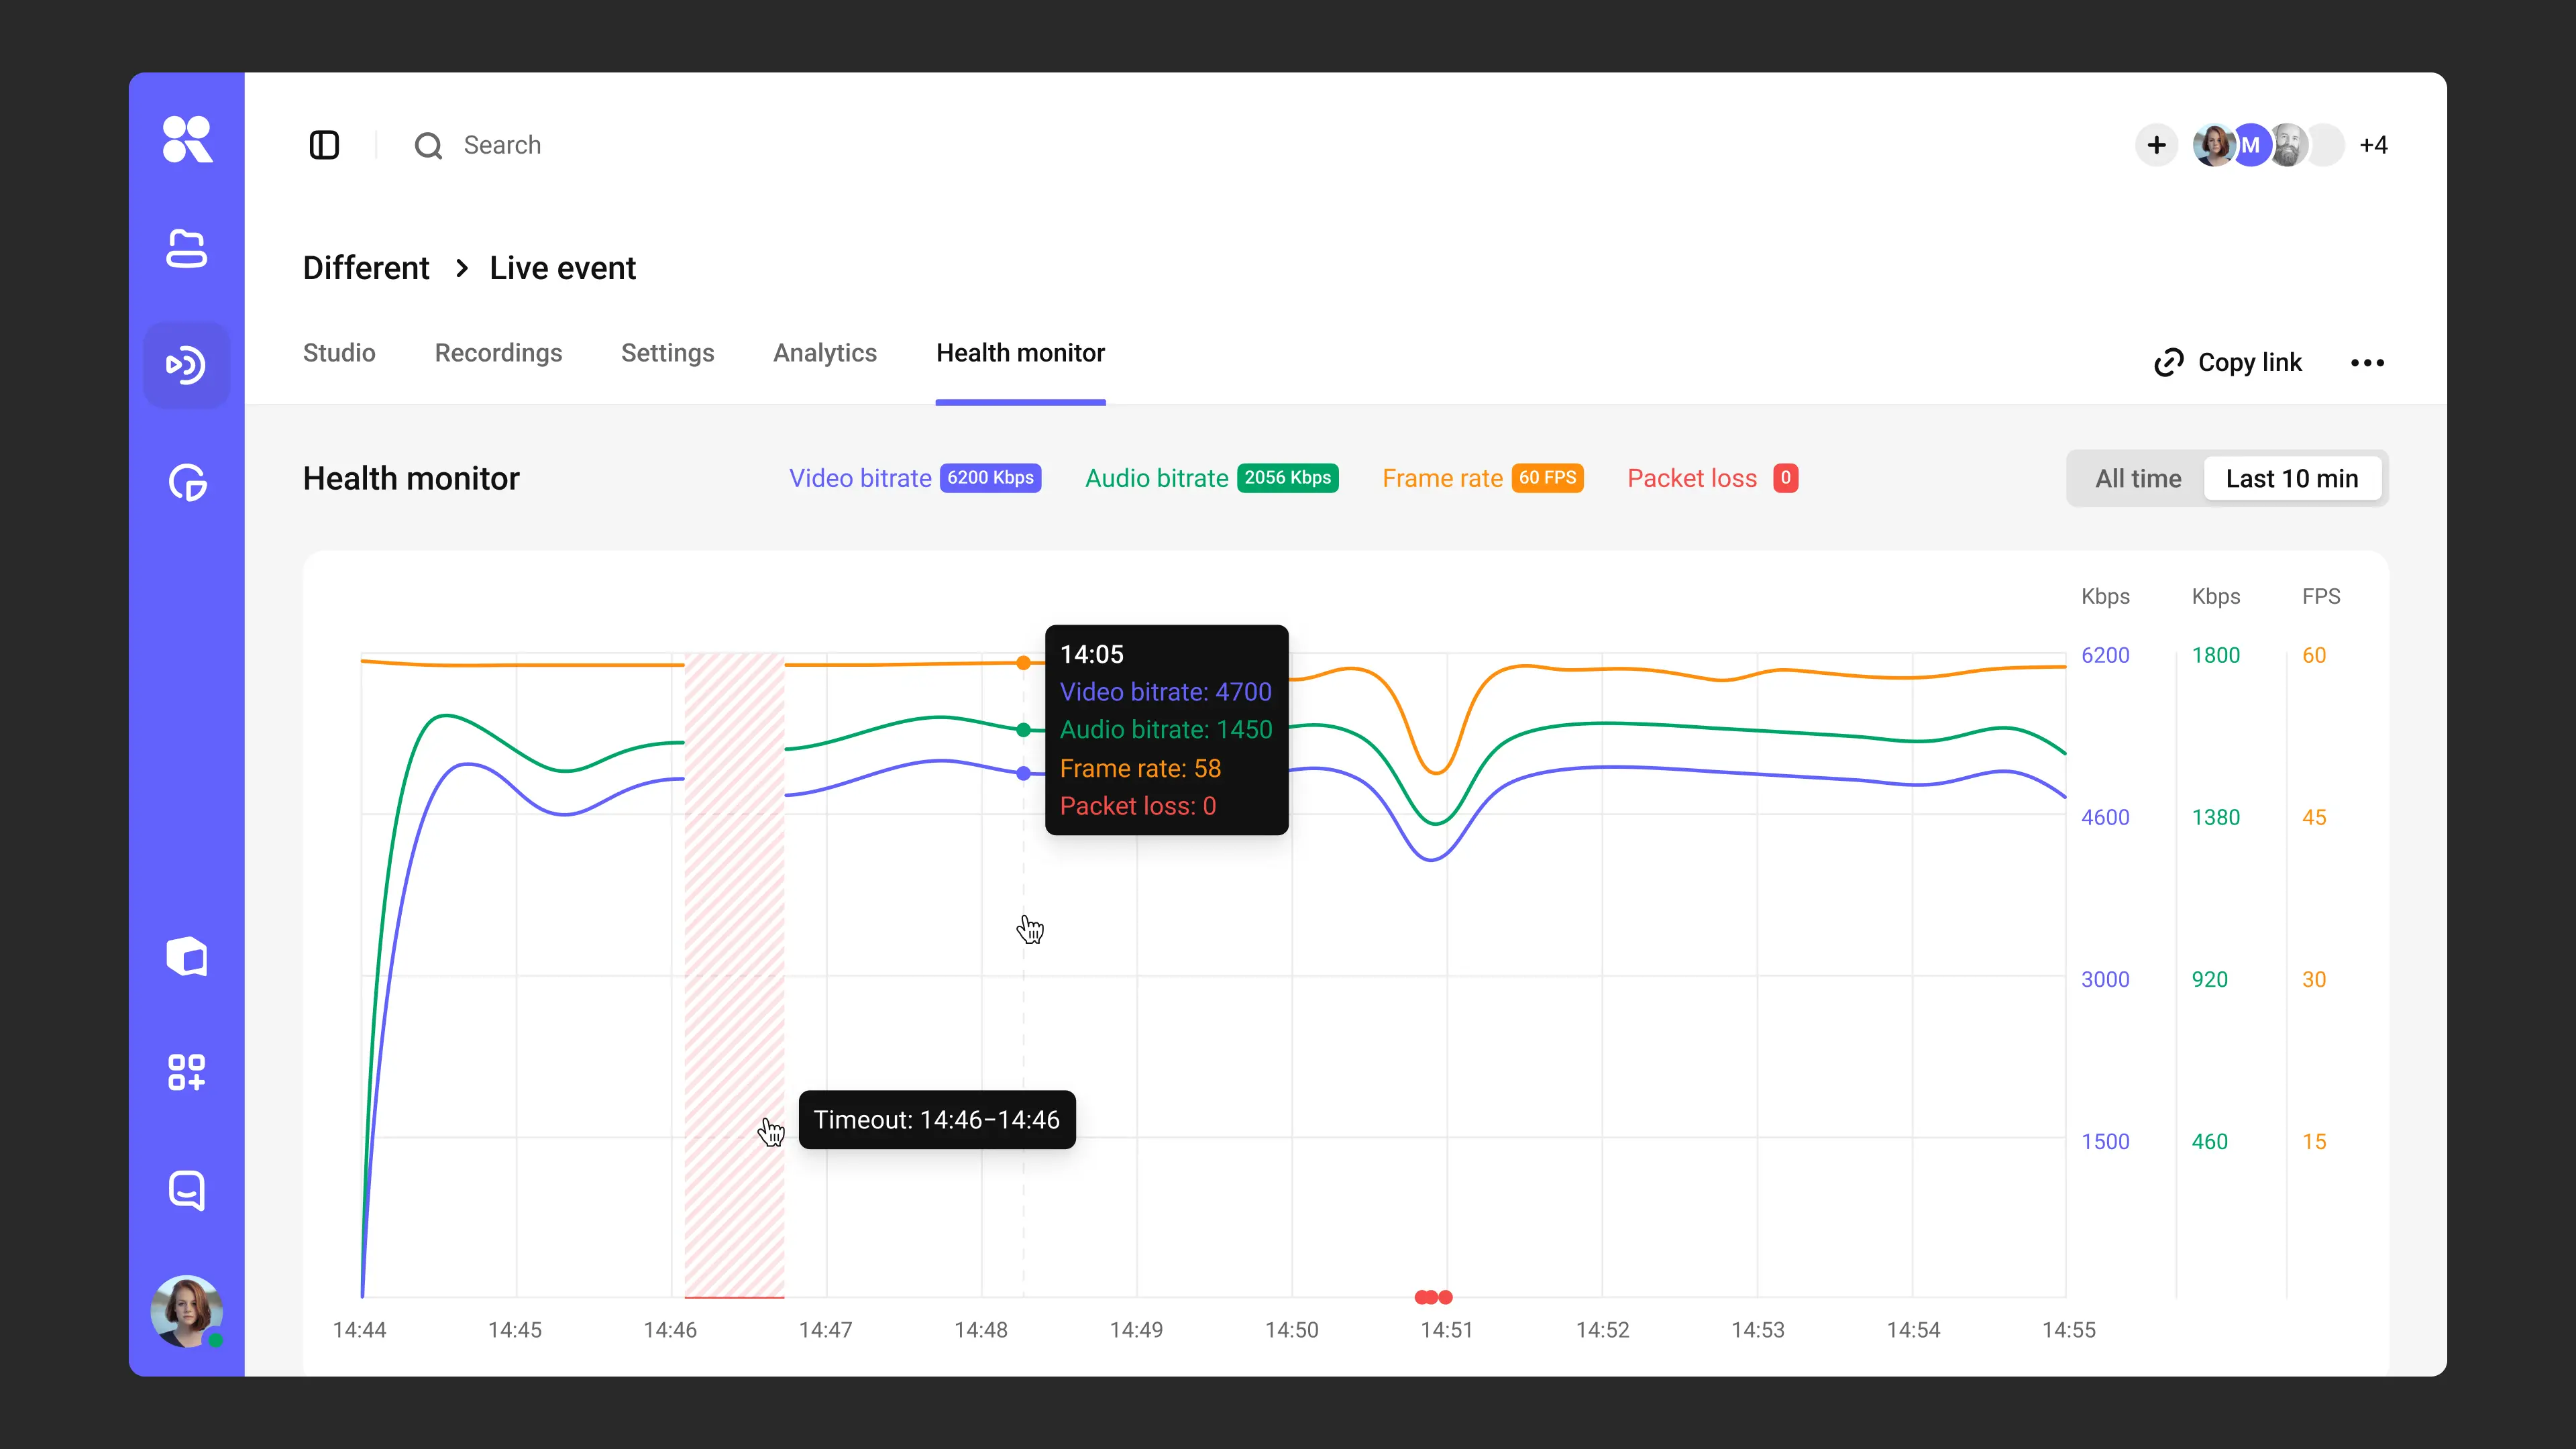
Metrics chart
Changes in metrics over time are displayed on an interactive chart:
- Lines — Video bitrate, Audio bitrate, FPS
- Points / separate line — Packet loss
- Highlighted intervals — timeout periods when no stream was received
- Tooltip — hovering over any point on the chart shows all metric values at that moment
Time periods
Two chart view modes are available during a broadcast:
- Last 10 min — the last 10 minutes of the broadcast
- All time — the entire broadcast from the beginning
Metrics after a stream ends
After the broadcast ends, the Health Monitor tab remains accessible. Data is stored indefinitely.
The historical view displays:
- A full chart for the entire broadcast duration
- All QoS metrics for every moment of the stream
- Timeouts (intervals without a stream) highlighted on the chart
Sessions
Opening Health Monitor first shows an All sessions list — similar to the Analytics section. The list appears for both one-time and recurring events. For each session it shows:
- Broadcast date
- Duration
- Number of packet losses
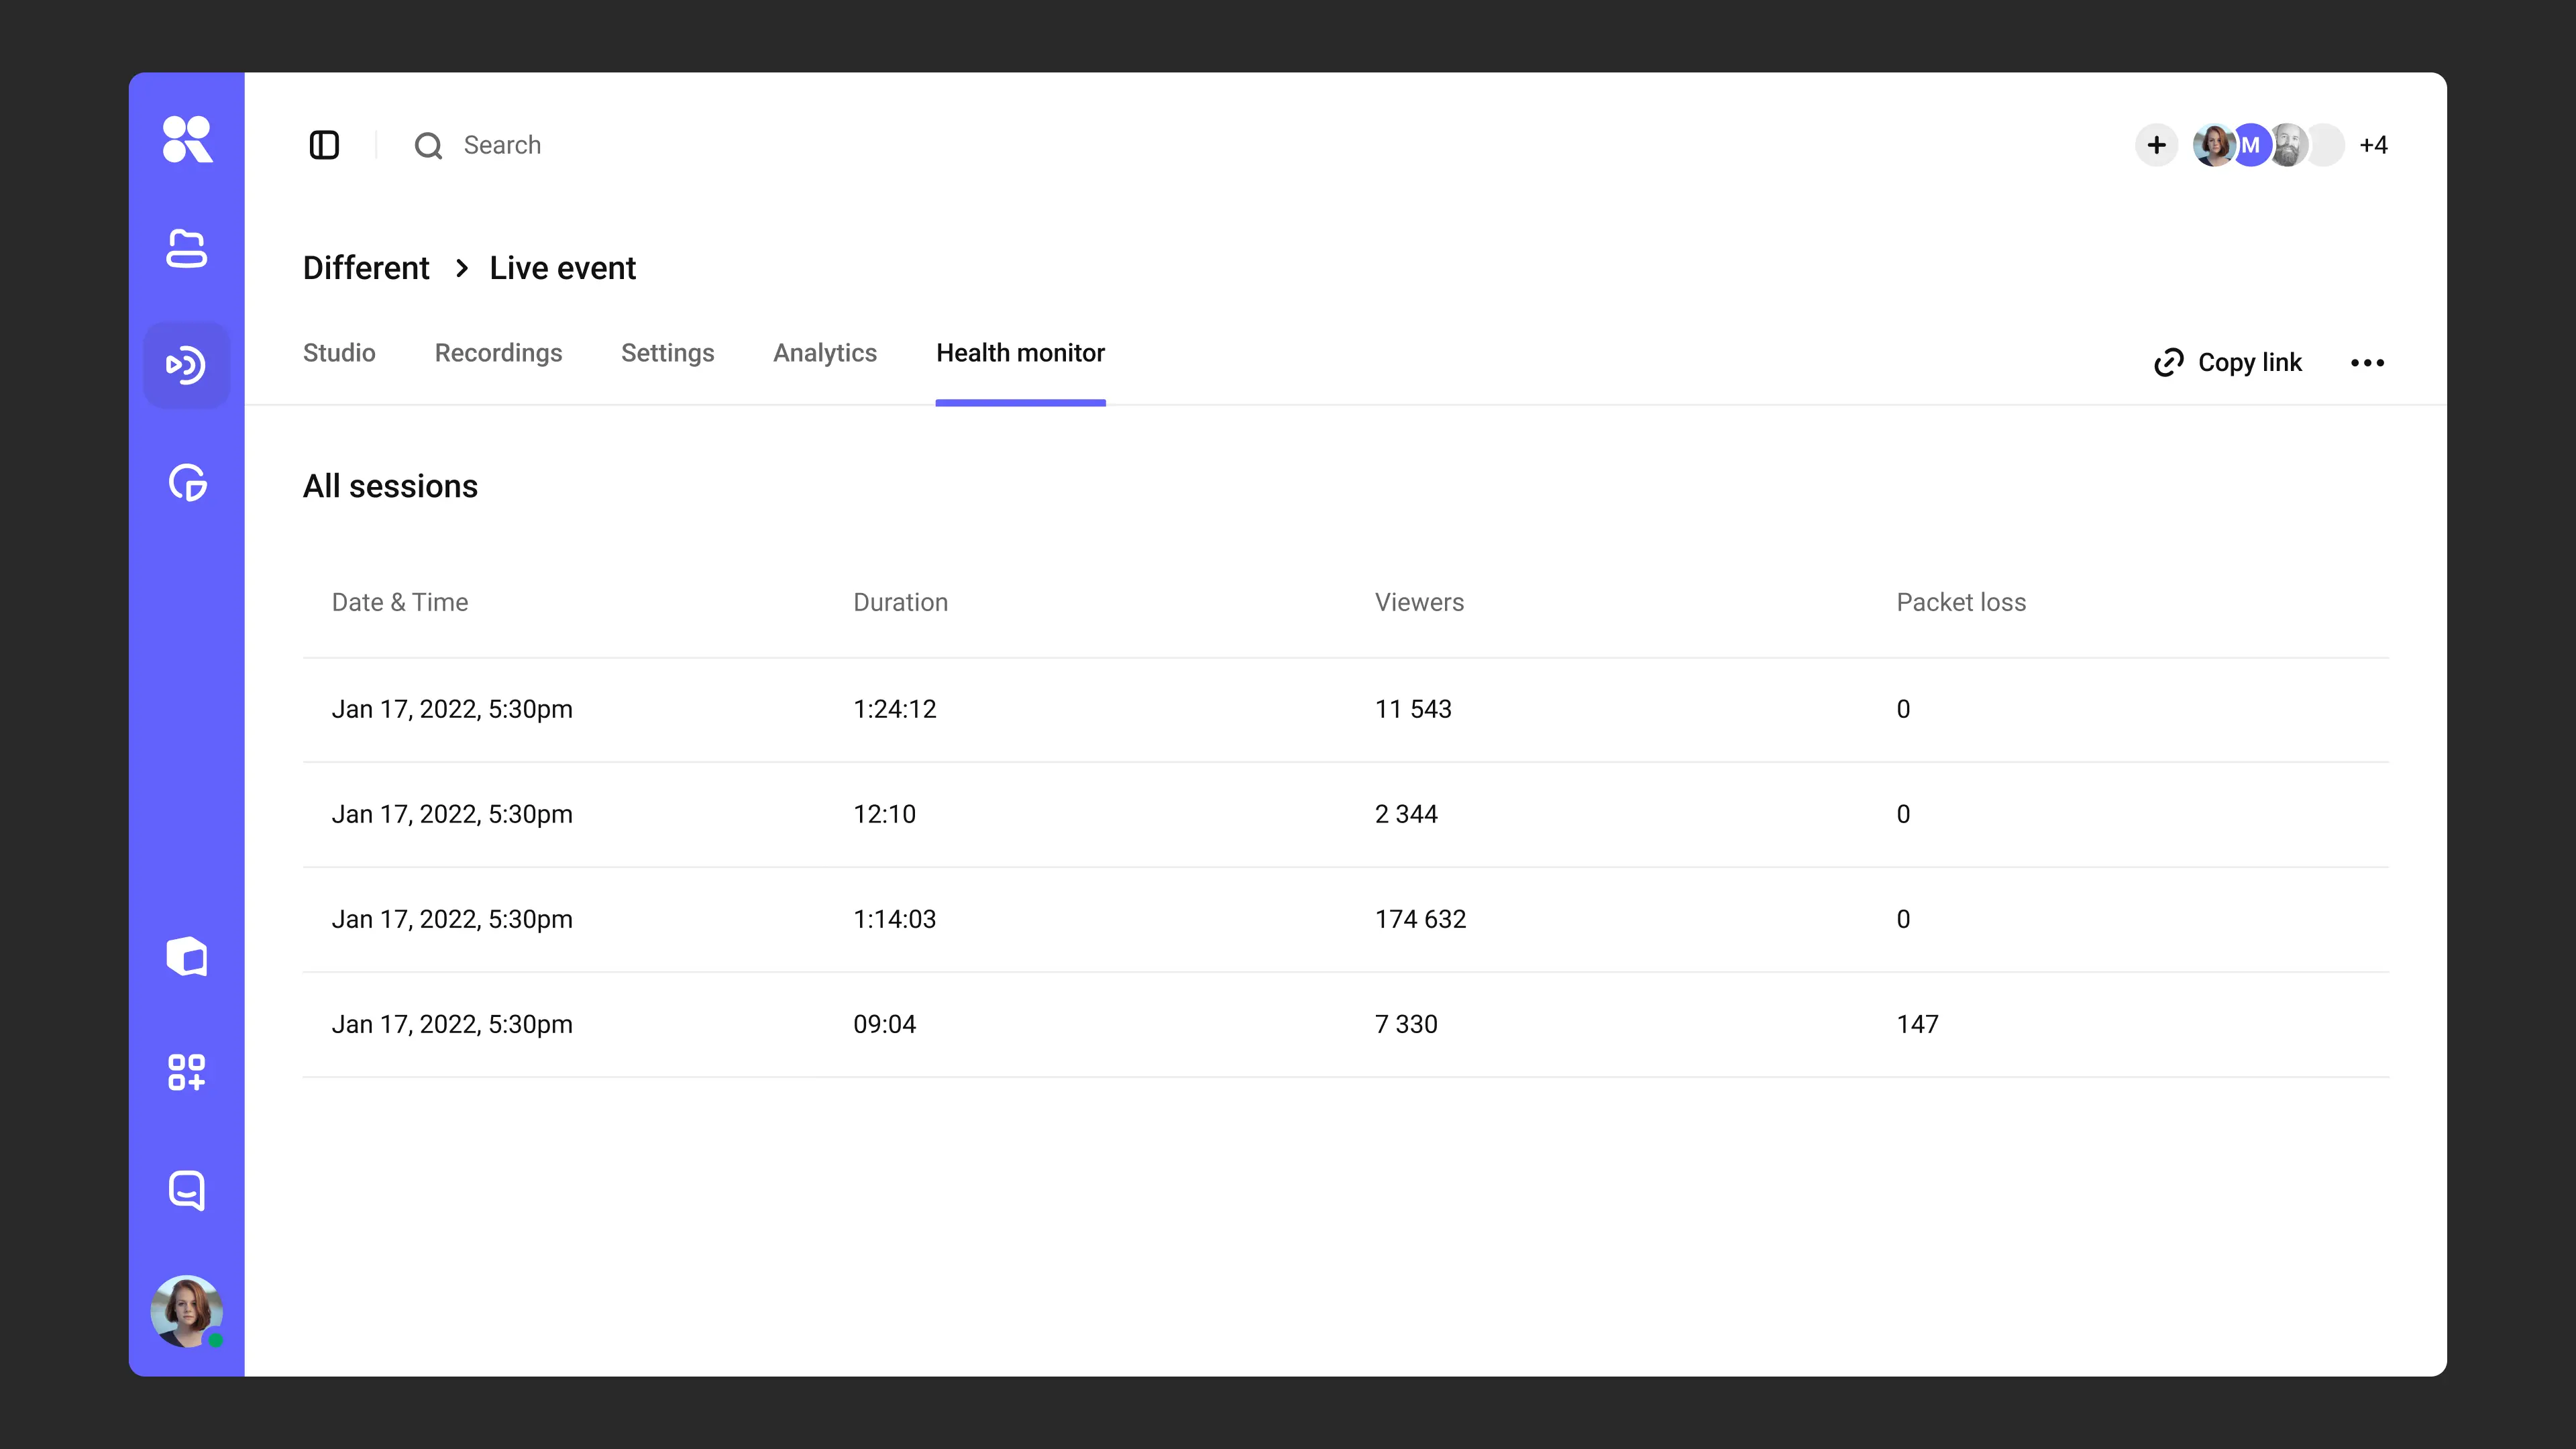
Select the required session to view its detailed metrics and chart.
What’s next?
- Live Stream Guide — general instructions for creating and starting a broadcast
- Stream Setup Instructions — encoder, resolution, and bitrate configuration
- Restreaming — broadcasting to multiple platforms simultaneously
Still have questions? Write to the support chat within the Kinescope interface — our specialists will help!