Analytics
Kinescope analytics collects data on the total number of views and player loads, watch depth, audience geography, platforms, OS, and browsers. This data helps you understand how your audience interacts with your content and optimize your video strategies.
Who this article is for
- Marketers — need to track video content performance and analyze audience behavior
- Content managers — need to understand which videos are popular and why
- Developers — need to integrate analytics into their systems via API
- Course creators — need to track student progress and engagement
Accessing analytics
Analytics is available both for individual videos and for the entire workspace:
For a specific video
- Open the catalog, find the video you need, and double-click its name.
- Go to the “Analytics” tab.
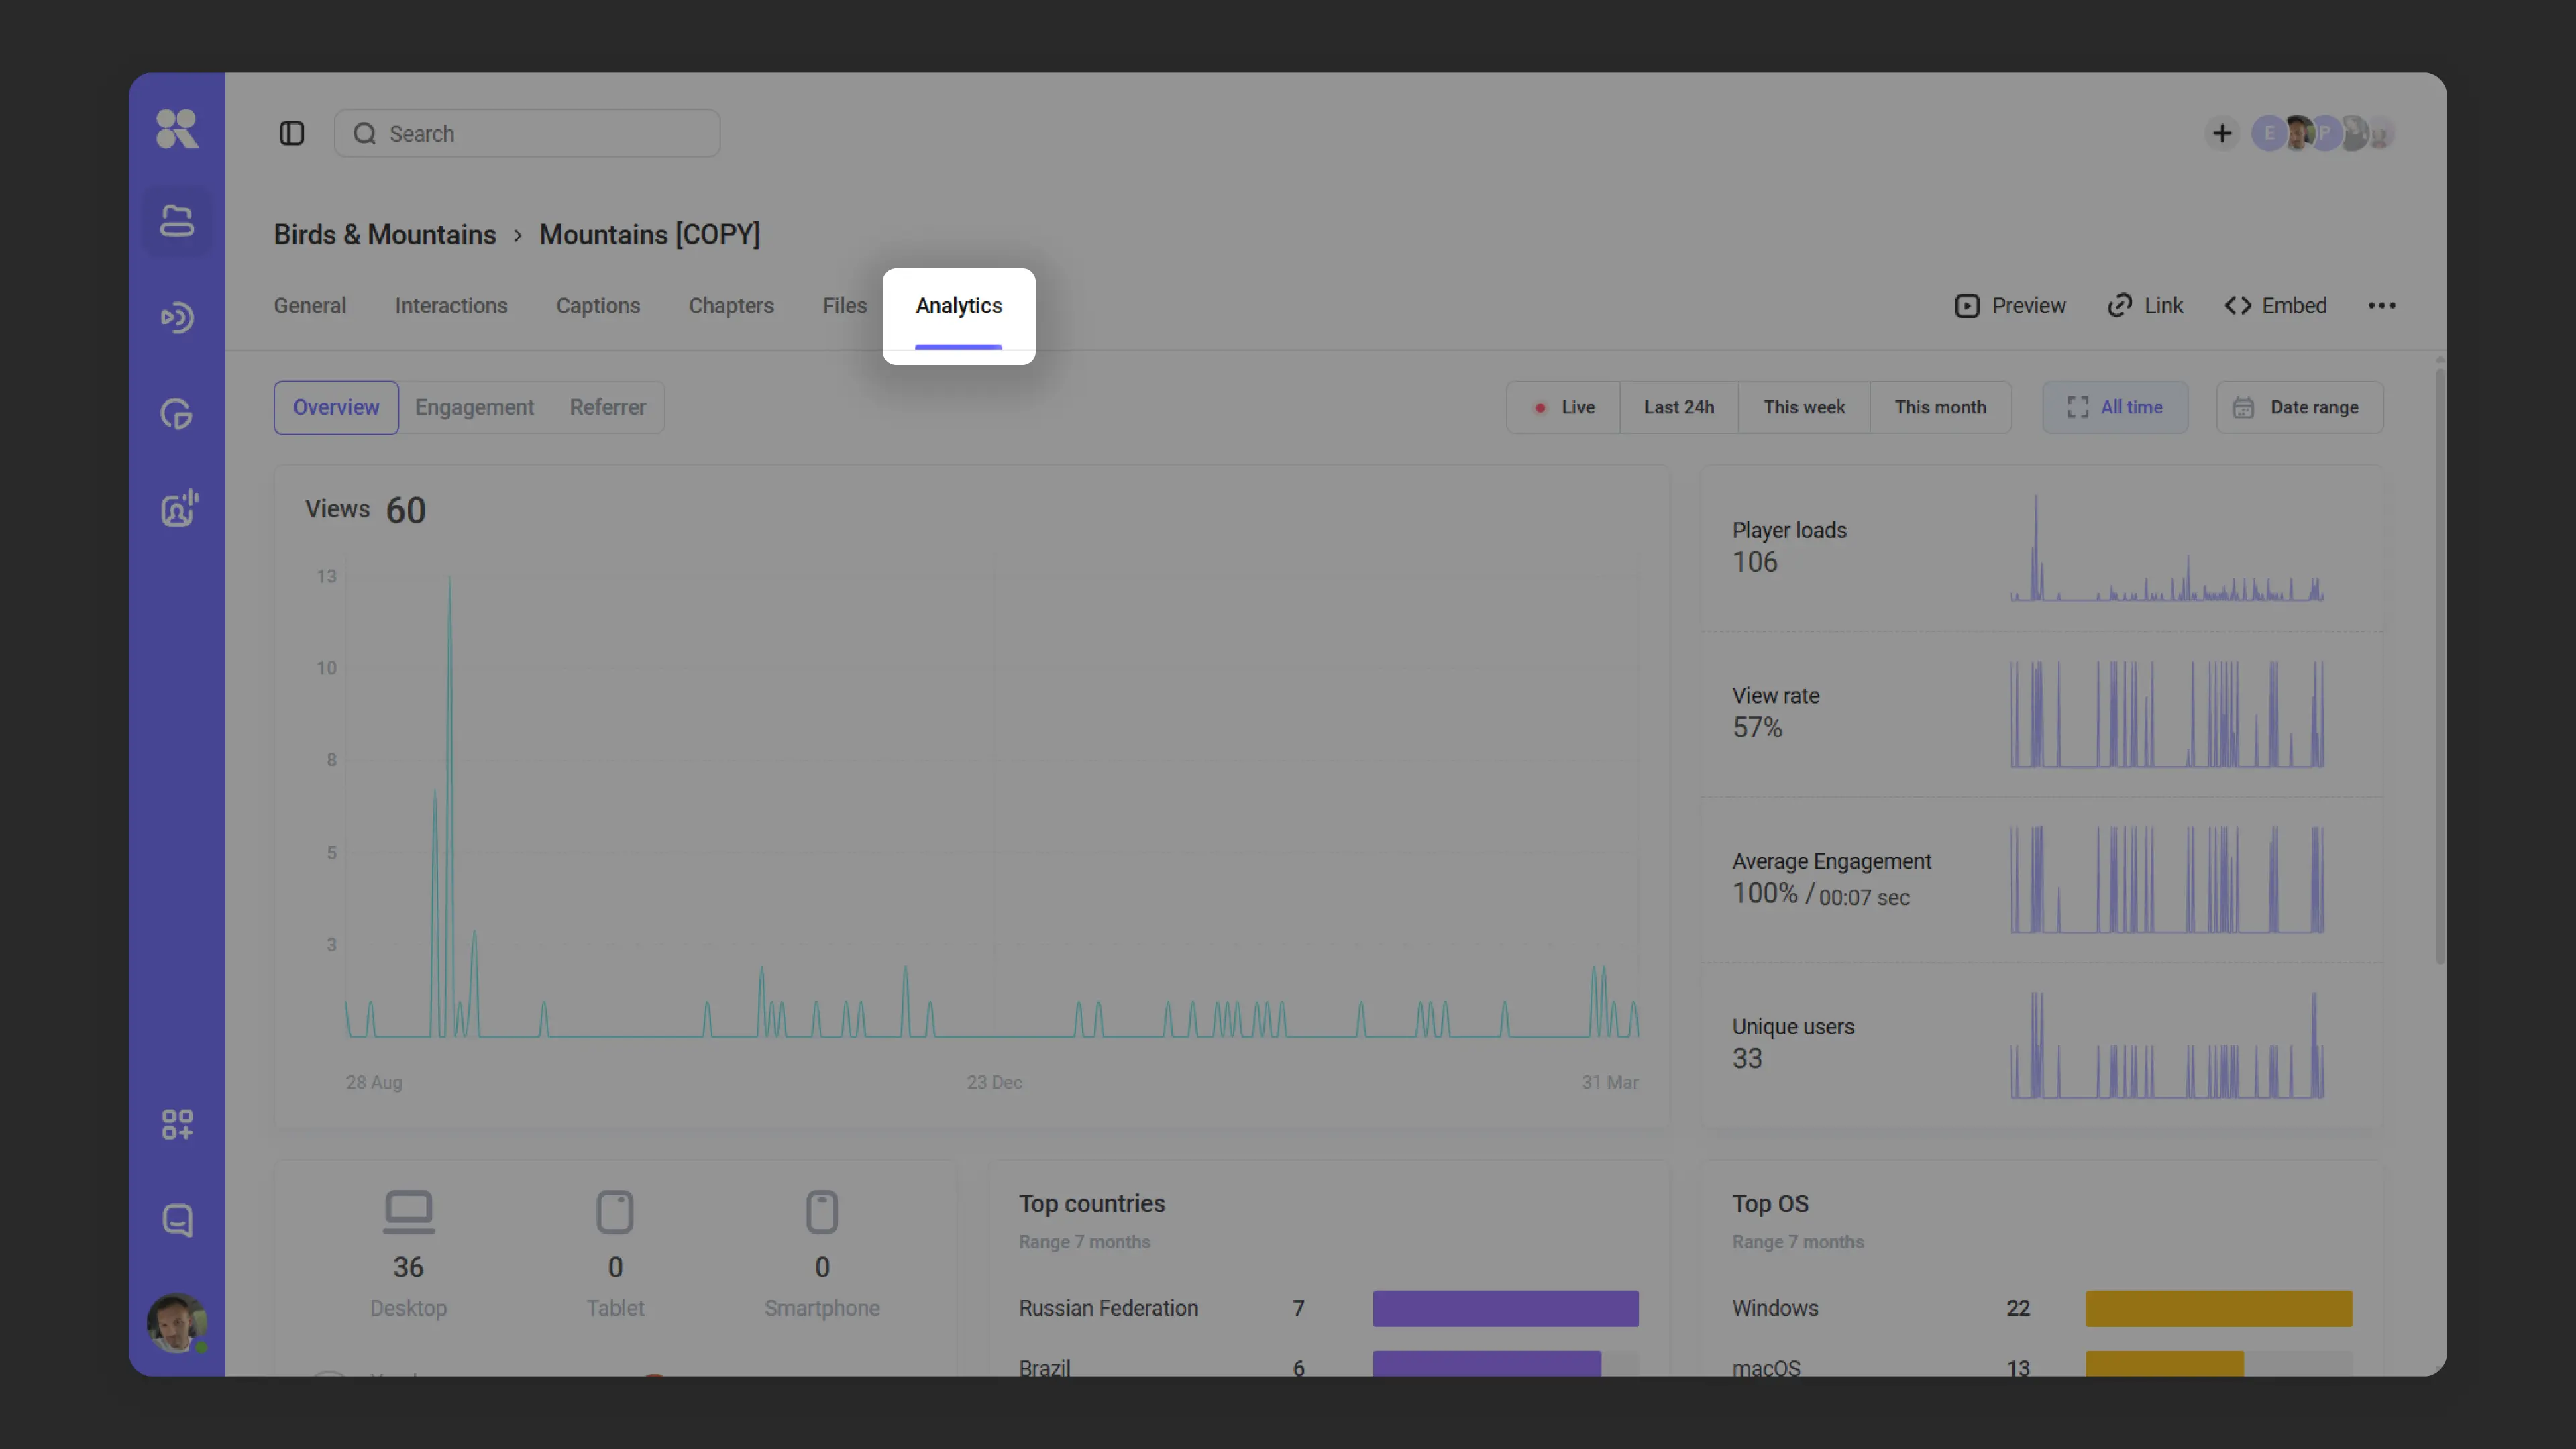
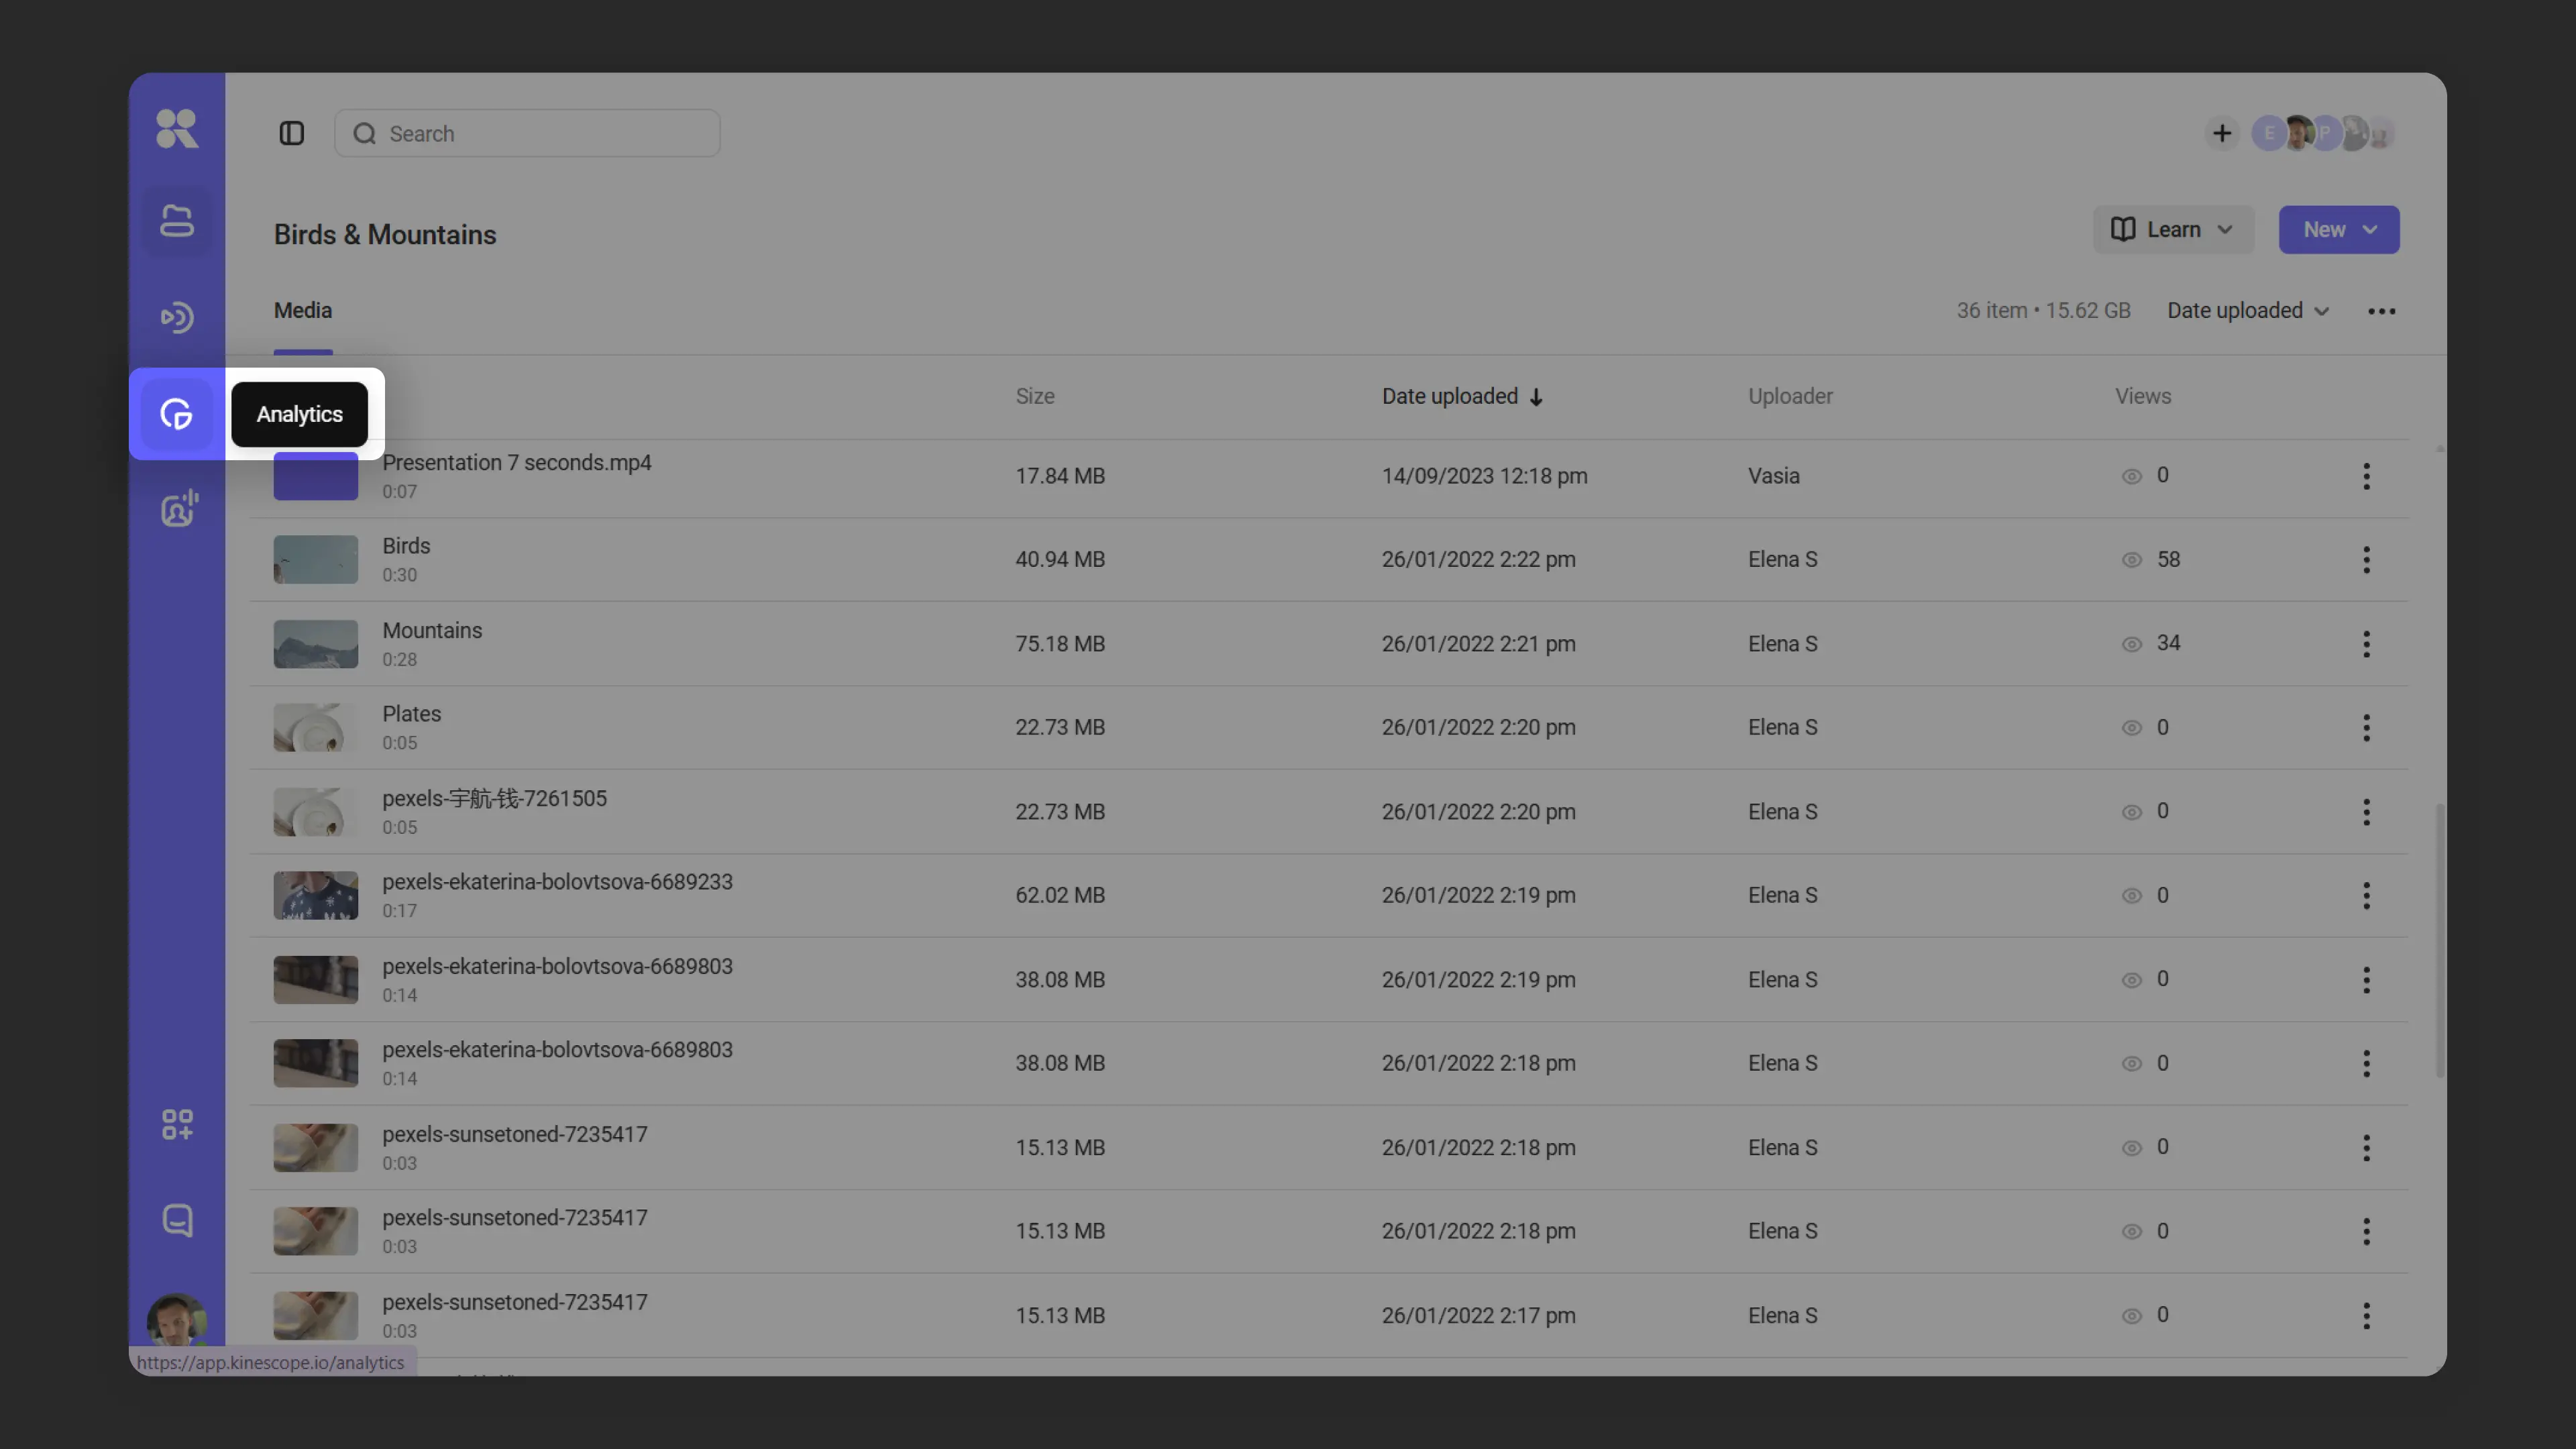
Analytics for a specific video For all videos in the workspace
- Click the “Analytics” icon in the left menu — it’s accessible from anywhere on the platform.
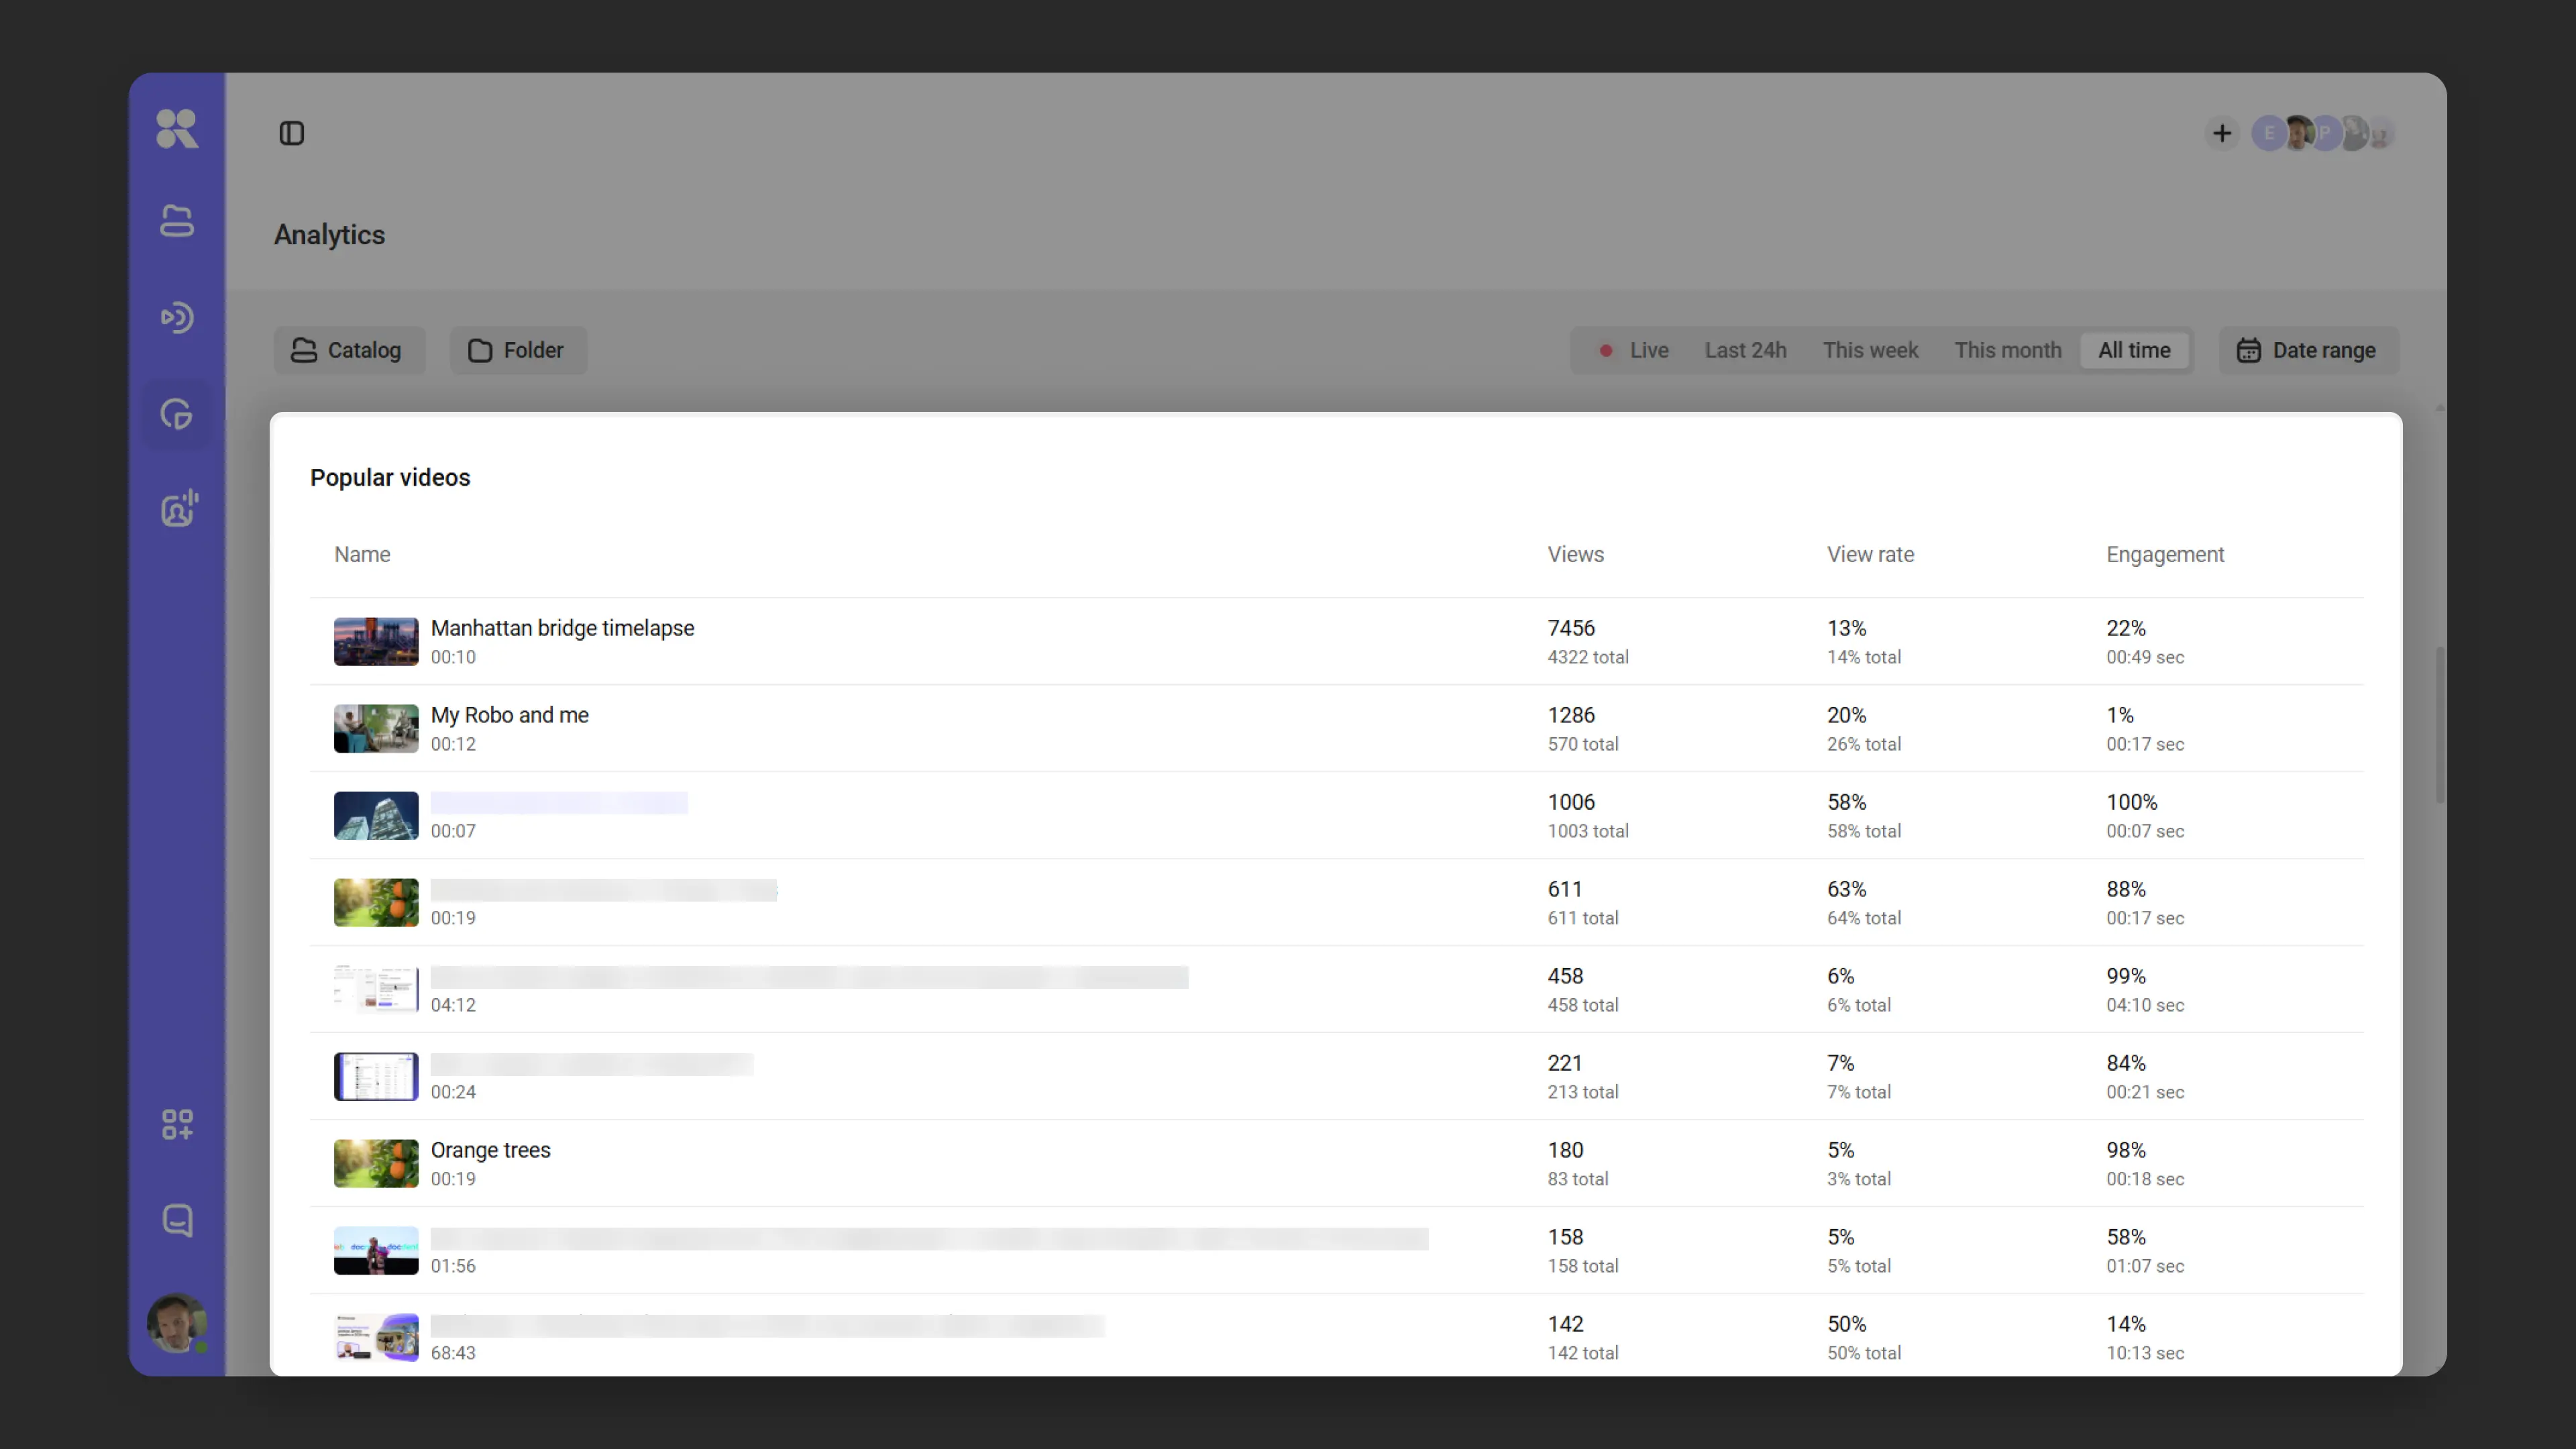
Overall workspace analytics
Overall analytics also includes the top 25 most popular videos. You can find it at the bottom of the page.
Key metrics
Views Shows the number of video starts. A view is counted after 5 seconds of continuous playback.
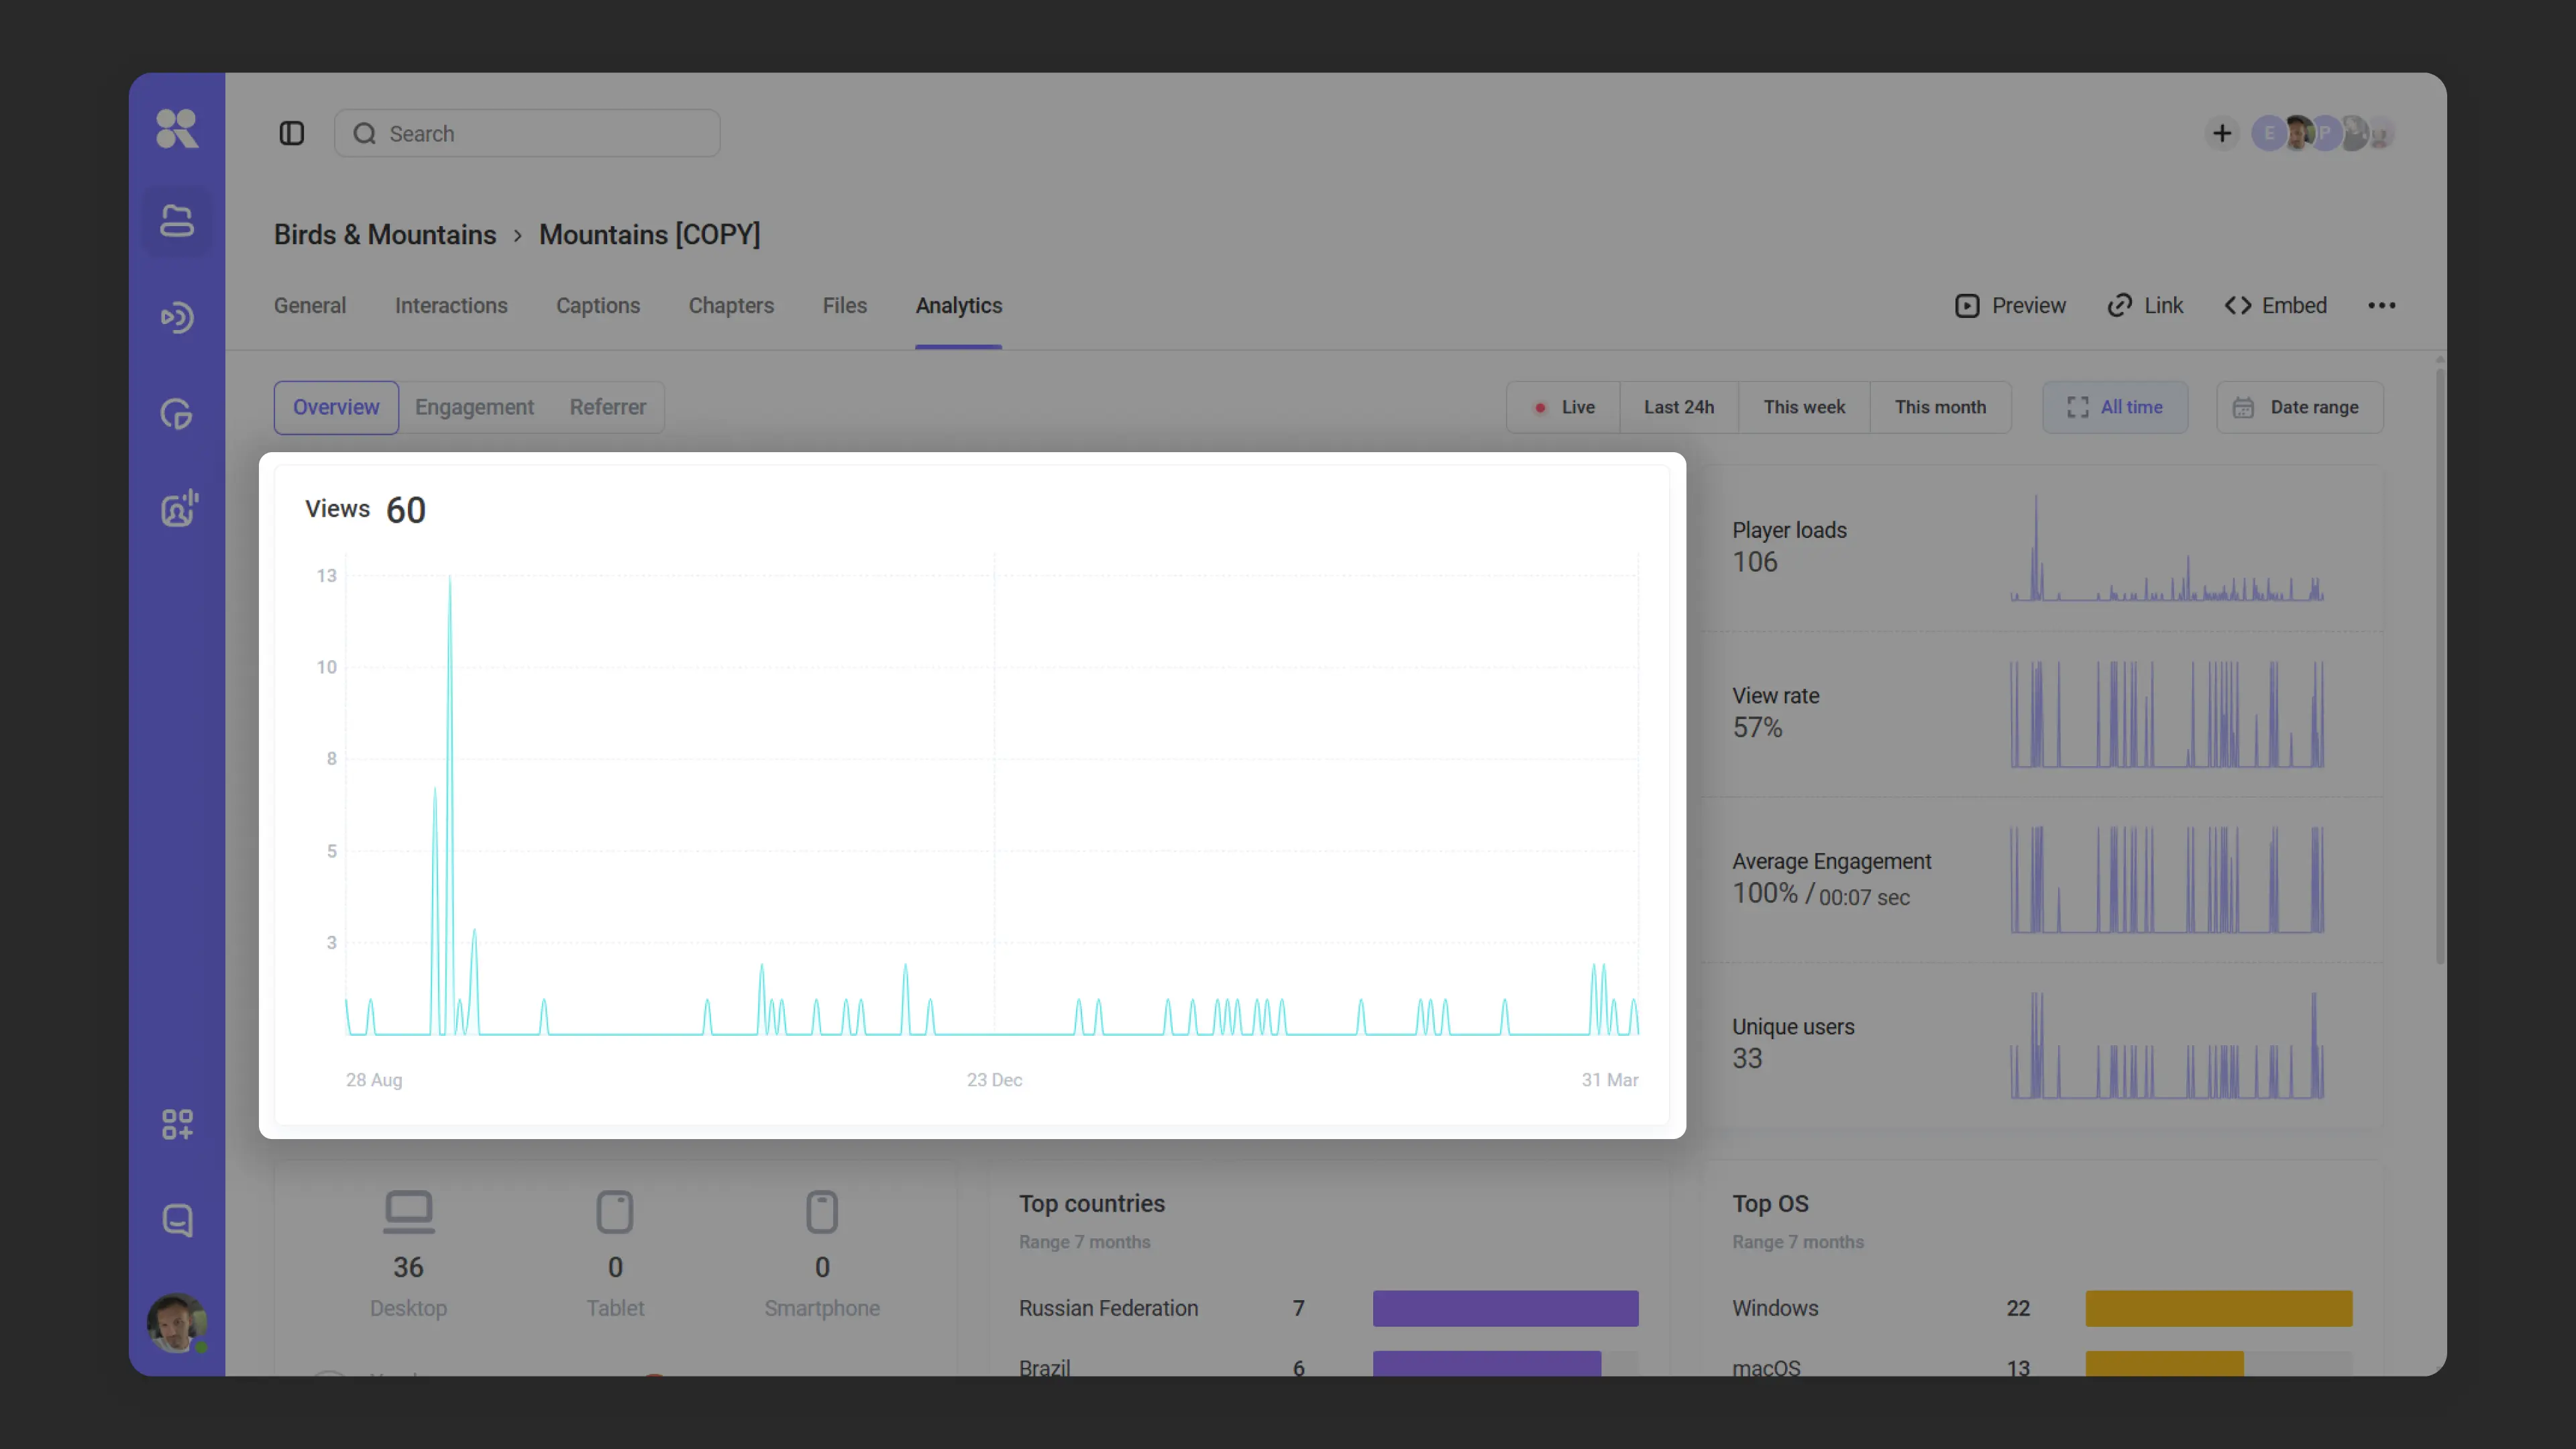
Player loads Shows how many times the player with the video was loaded on a page. If you open a page with video and then refresh it, that counts as two player loads.
View rate
This metric roughly reflects interest in the video, the effectiveness of player placement, or the attractiveness of the poster.
- Chart: the ratio of views to player loads.
- Percentage: the overall ratio of all views to all player loads over all time. In the screenshot above: 20 views / 85 player loads = 24% (rounded up).
Unique impressions The player remembers the device session and counts uniqueness by session.
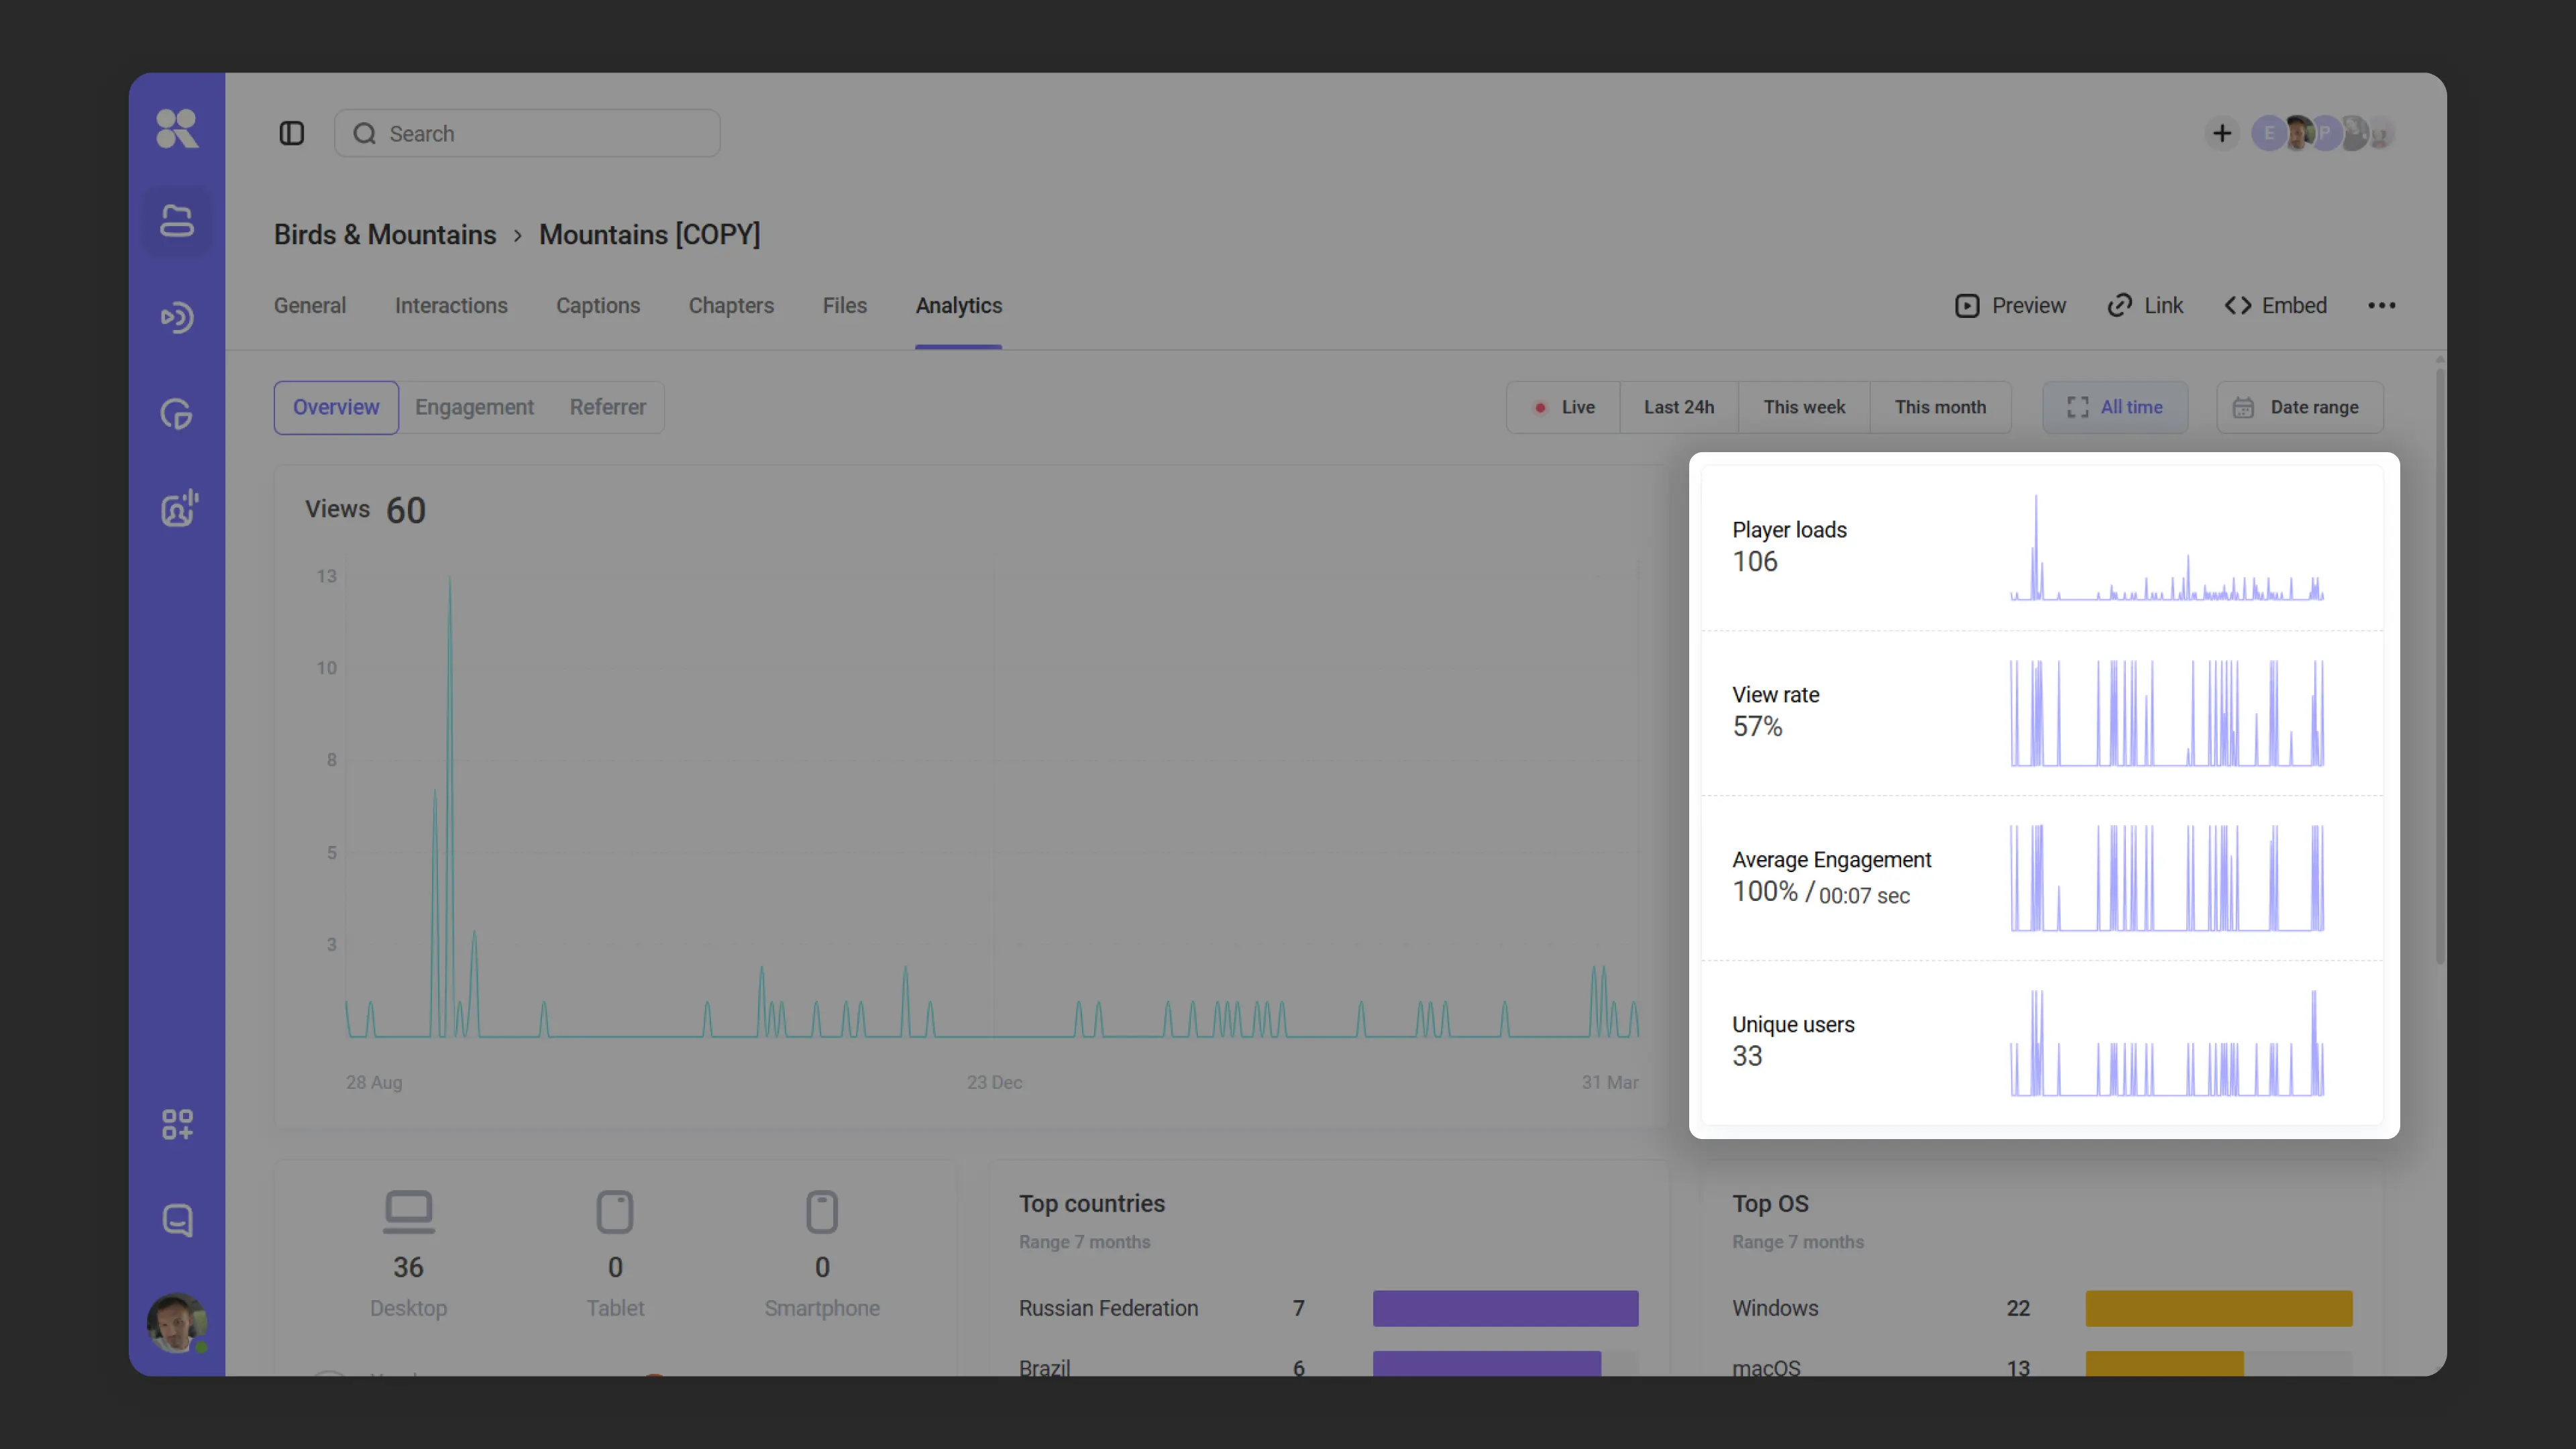
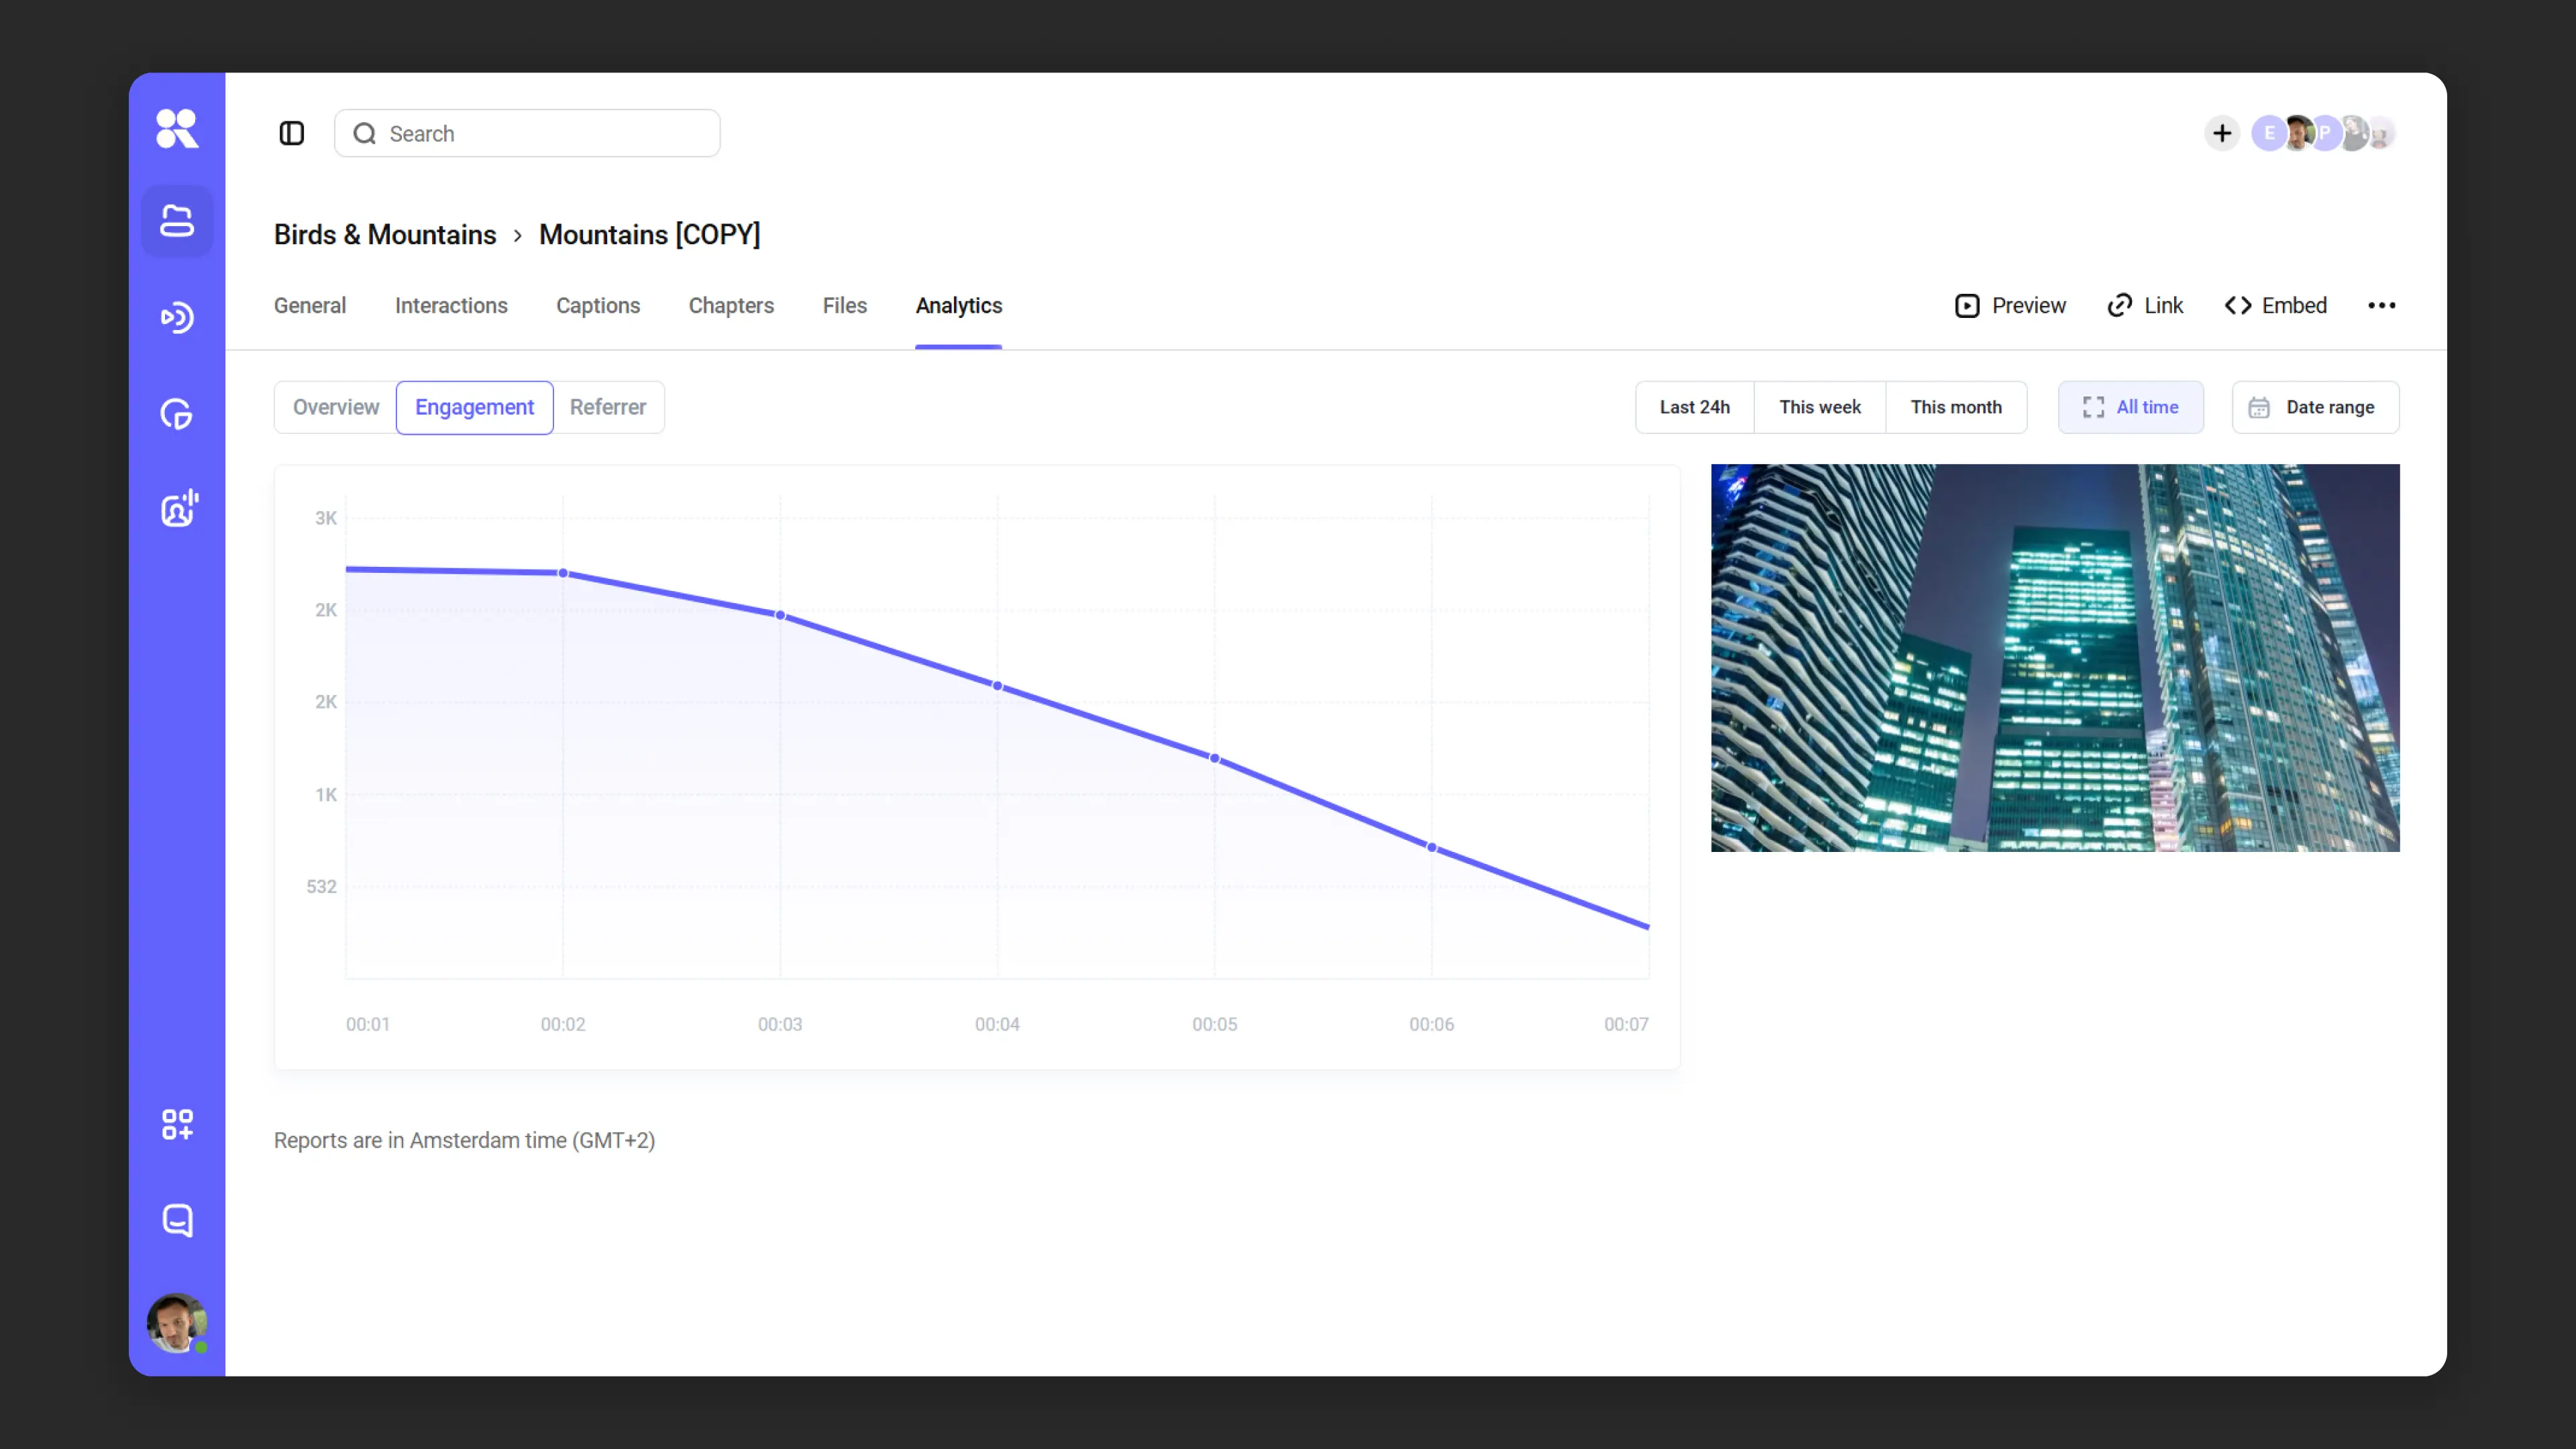
Engagement or watch depth Shows the average watch time (how many minutes a user watched out of the total video length) and how that value changed over the selected time period.
A view is counted within a single session: in one session a user can watch the video multiple times, but it is counted as one view.
If within one session a user rewatches the same segment multiple times, it counts as one view of that segment.
This metric shows how high-quality the content is — and therefore how well it can hold viewer attention.
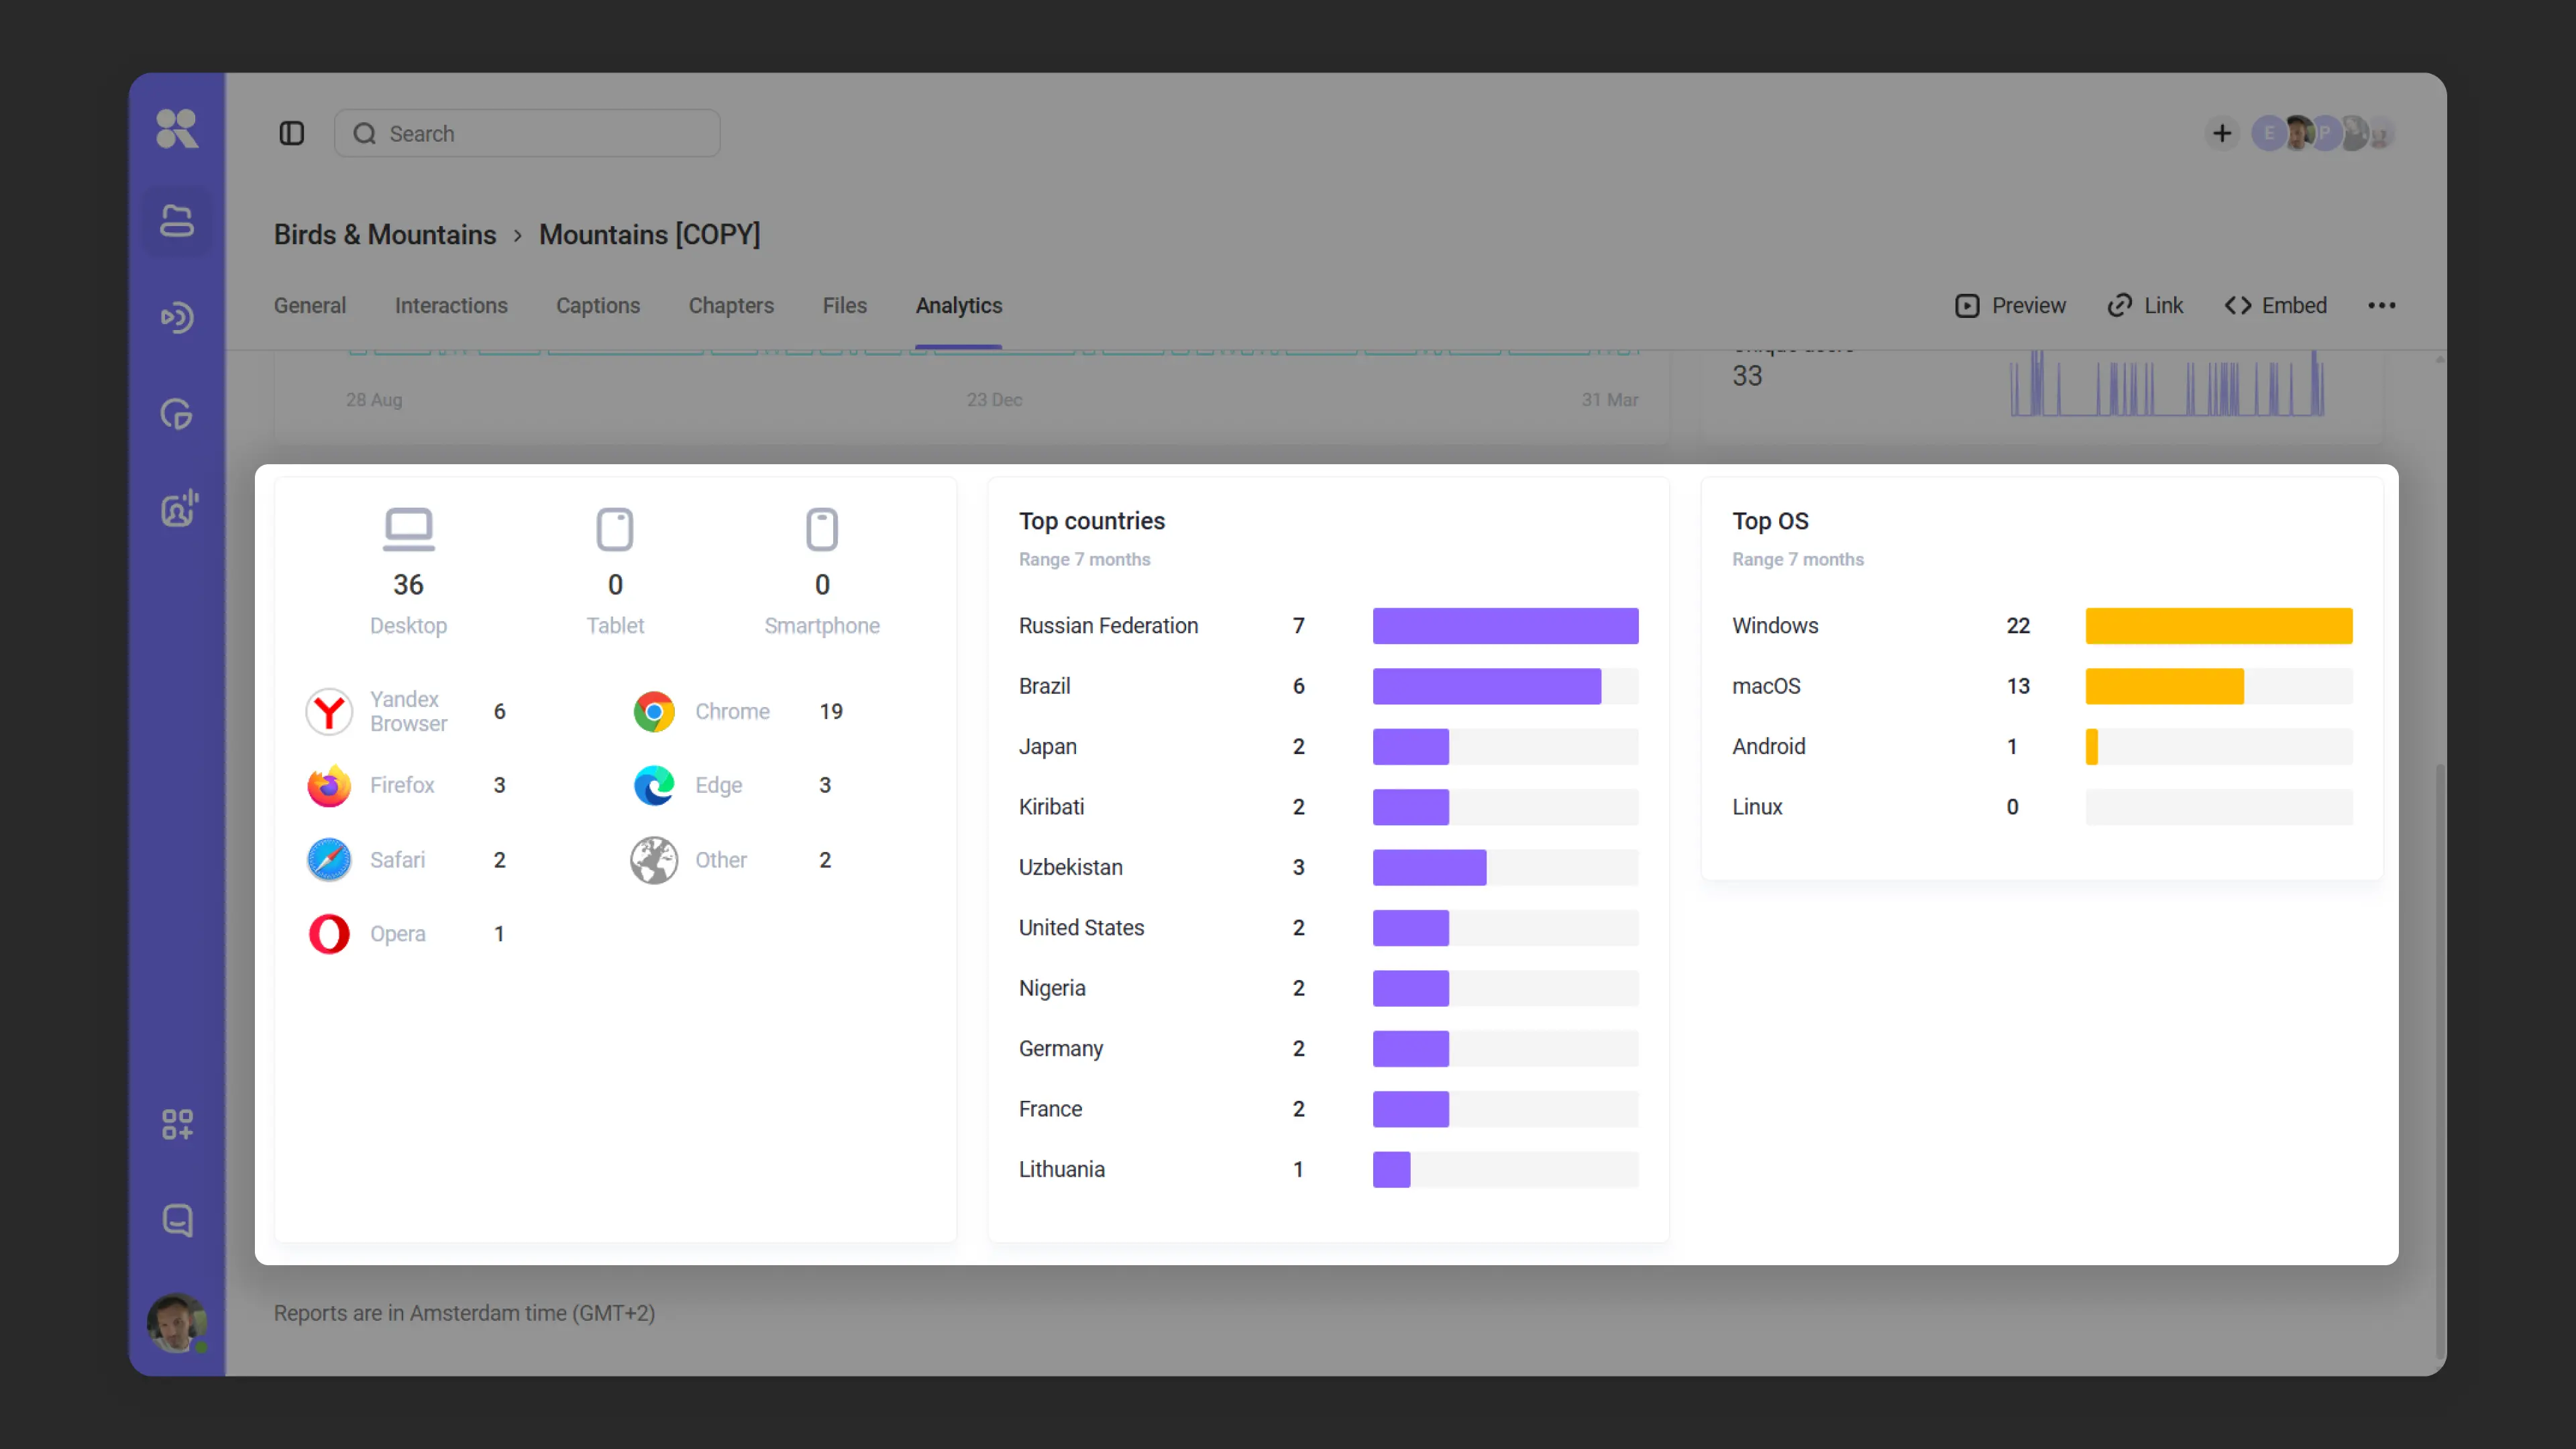
Top countries, platforms, and OS View data broken down by country, platform (desktop, tablet, smartphone), and operating system.
Referrers (placement sources) Shows which pages and domains the player loads on, and how effective each placement is. Useful for comparing traffic quality across sources and finding placements with a low view rate.
Open the “Referrer” sub-tab in the “Analytics” tab — it shows a table with the columns:
- URL — the page where the player is embedded
- Views — number of video starts (a view is counted after 5 seconds of playback)
- Player loads — how many times the player was loaded on the page
- View rate — ratio of views to player loads (
Views / Player loads × 100%)
Rows are grouped by domain: the domain appears as a parent row with total metrics, and individual pages are listed under it. Groups can be collapsed and expanded. The period can be set using the filter (“Last 24 hours”, “This week”, “This month”, “All time”, or “Period”). Data can be exported to CSV or XLSX using the “Export” button.

Report export
If there is a lot of data or you need to feed it into your own reporting, export the analytics to a file. The report is built in the background on the Kinescope side, and once it is ready it arrives at the specified email as a ZIP archive containing a CSV or XLSX file. Inside the archive each row corresponds to one video, broadcast, or stream recording — data is grouped by identifier.
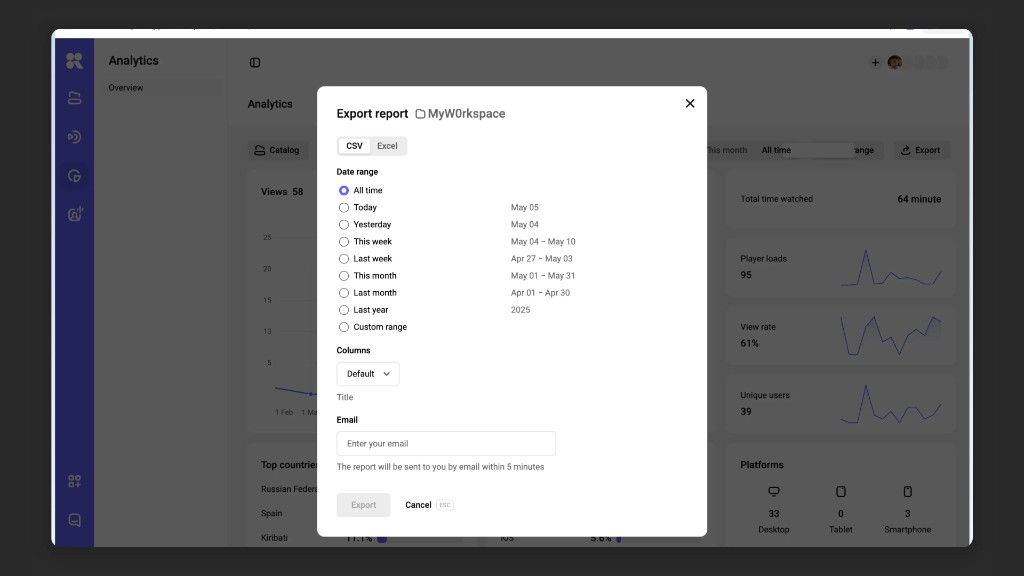
How to build a report
- Open the “Analytics” section → click “Export report”.
- Choose the period for which you need the data (see the list below).
- Select the folders to include in the report. If a folder with nested folders is selected, data from the nested folders is also included.
- Select the fields to include in the file (see the table below).
- Choose the file format: CSV or XLSX.
- Enter the email address to send the report to and click “Generate”.
The report settings dialog will close. When the report is ready, an email with a link to the ZIP archive will be sent to the specified address.
Period
Both fixed ranges and a custom period are available:
- All time
- Today
- Yesterday
- This week
- Last week
- This month
- Last month
- Last year
- Custom period — set the start and end dates manually.
Report fields
Fields are split into three groups. Some fields appear in the report only for the matching content type — for example, the broadcast identifier is exported only for stream events.
Content identification
- Project ID (
project_id) - Project name (
project_name) - Video ID (
video_id) — required field for video rows. - Stream ID (
stream_id) — required field for stream rows. - Event ID (
event_id) — required field for broadcast event rows. - Title (
title) - Duration (
duration) - Folder (
folder_name) — path to the file, for examplefolder1/folder2. - Folder ID (
folder_id)
Analytics metrics
- Player loads (
player_loads) — how many times the player with the video was loaded on a page. - Unique impressions (
unique_views) — unique sessions in which the video was started. - Views (
views) — number of video starts; counted after 5 seconds of continuous playback. - Total watch time (
total_watch_time) — how long viewers watched in total over the selected period. - View rate — calculated as
total_watch_time ÷ (views × duration) × 100%and shows watch depth across content for the selected period.
Stream metrics
- Peak concurrent viewers (
peak_concurrent_viewers) — peak number of viewers watching the broadcast at the same time.
Things to keep in mind
- The report is built across the selected folders, including nested ones — the list matches what you see in the catalog.
- If a piece of content has no views during the selected period, the row still ends up in the report with all metric values equal to zero — convenient for reconciling the content list.
- One report — one email. To send a copy to your colleagues, forward the message manually or generate the report again with another address.
- The archive link stays available for a limited time. If the link expires, generate the report again.
Advanced analytics for developers
For deeper analysis and integrating analytics into your systems, two approaches are available:
IFrame Player API — for client-side analytics
IFrame Player API helps collect client-side events and send them to your analytics platform along with context (for example, user ID, course, lesson, device, browser). This is typically used when you need to:
- In LMS — track progress, watch time, and rewinds.
- In interactive scenarios — understand how users interact with video (pauses, rewinds, etc.).
- In corporate portals — log employee activity around video content.
- In integrations — send events to your analytics systems, CRM, or LMS.
Using IFrame Player API, you can capture not just views but detailed events (pauses, rewinds, replays) and react to them in real time.
Learn more about IFrame Player API capabilities in the article IFrame Player API .
Analytics REST API
All analytics data is also available via REST API. Capabilities include:
- Sorting data by date, video ID
- Custom grouping by fields and parameters
- Retrieving statistics for any time period
Analytics API (for developers):
Overall statistics for a period:
curl -X GET "https://api.kinescope.io/v1/analytics/overview?from=2024-01-01&to=2024-01-31" \
  -H "Authorization: Bearer ${KINESCOPE_API_TOKEN}"
Request parameters:
from(required) — period start inYYYY-MM-DDorYYYY-MM-DDTHH:MM:SSZ(RFC3339) formatto(required) — period end inYYYY-MM-DDorYYYY-MM-DDTHH:MM:SSZ(RFC3339) formatproject_id(optional) — filter by projectvideo_id(optional) — filter by video
Detailed statistics with grouping:
curl -X GET "https://api.kinescope.io/v1/analytics?from=2024-01-01&to=2024-01-31&group_by=video_id&order=views.desc&per_page=10" \
  -H "Authorization: Bearer ${KINESCOPE_API_TOKEN}"
Request parameters:
from(required) — period start inYYYY-MM-DDorYYYY-MM-DDTHH:MM:SSZformatto(required) — period end inYYYY-MM-DDorYYYY-MM-DDTHH:MM:SSZformatgroup_by(required) — data grouping. Available values:video_id— by videoproject_id— by projectdate— by daycountry— by country
project_id(optional) — filter by projectvideo_id(optional) — filter by videopage(optional) — page number (default: 1)per_page(optional) — items per page (default: 10)order(optional) — sorting infield.directionformat (e.g.views.desc). Learn more about sorting in the general API guidelines
Error handling:
If parameters are invalid, the API returns a validation error with code 400400. For example, if the required from or to parameters are missing, or an invalid sort field is specified (code 400216). Learn more about error handling in the general API guidelines
.
Additional value can be gained by linking player view data to user sessions. This approach lets you collect analytics not just around video, but around specific viewers.
To personalize analytics, embed the player using IFrame API
, and when creating the player on a page
pass the user identifier (such as email or ID) via the externalId parameter.
What’s next?
After exploring analytics, we recommend:
- Optimize content — use analytics data to improve posters and descriptions
- IFrame Player API — use IFrame Player API for advanced analytics enriched with contextual data
- Set up analytics integration — connect analytics to your systems via REST API
- Embedding — configure the player for analytics data collection
Still have questions? Write to the support chat within the Kinescope interface — our specialists will help!